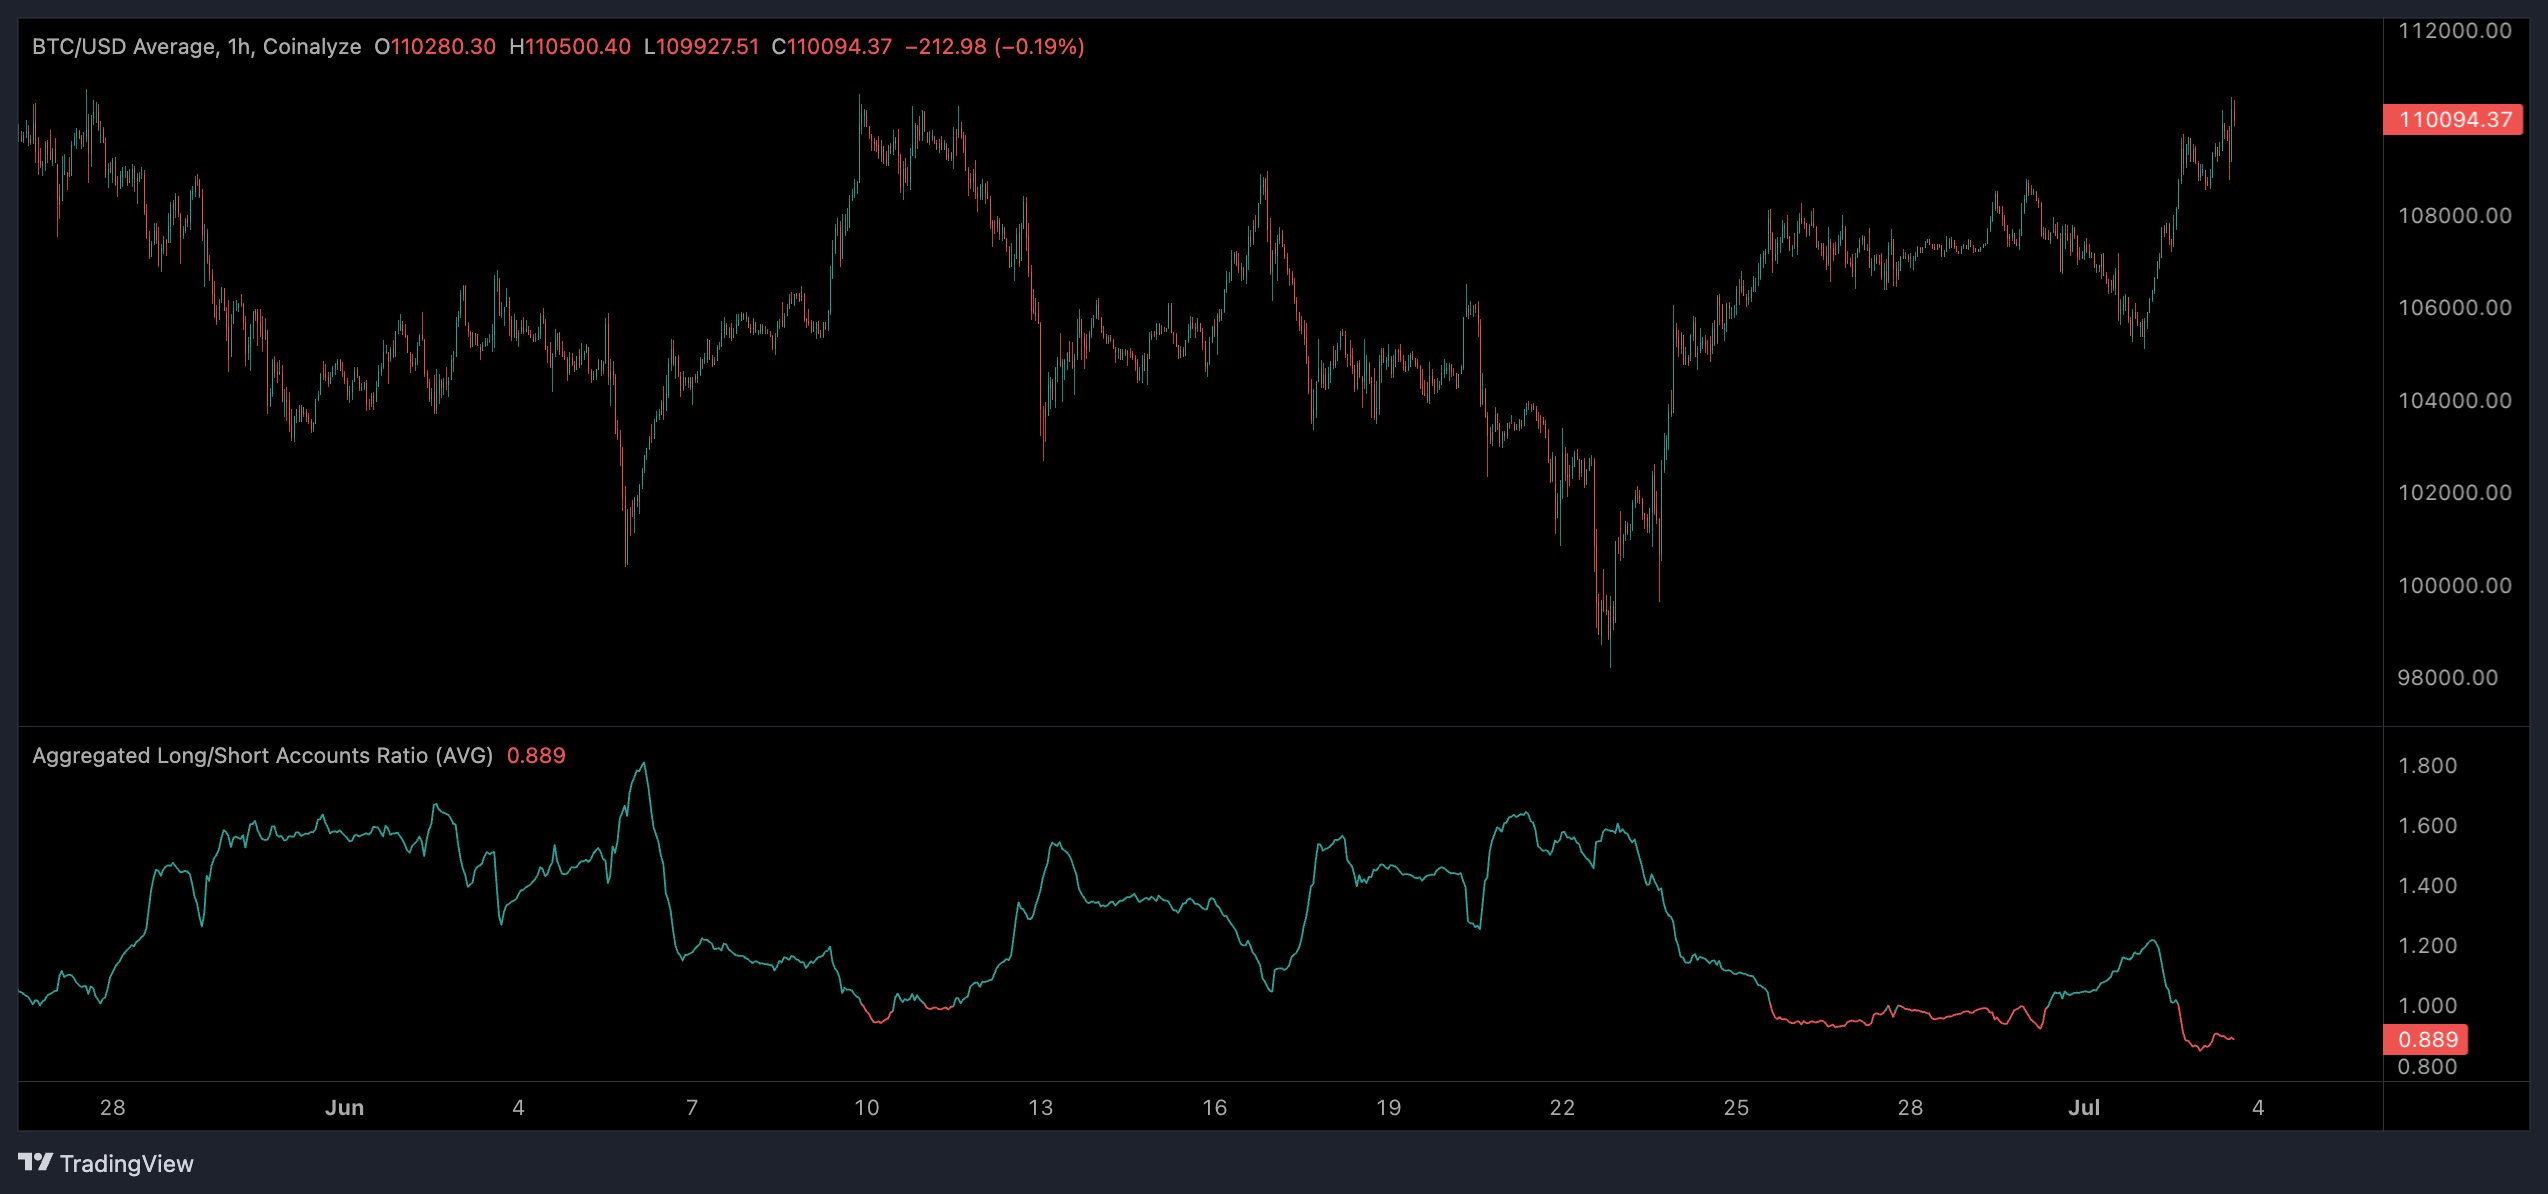
Crypto traders are exhibiting bearish behavior despite bitcoin BTC trading above $110,000 and possibly taking aim at a new record high above $112,000.
Data from Coinalyze shows that during bitcoin’s move this week from $106,000 to $110,000, the long/short ratio fell from 1.223 in favor of longs to 0.858 in favor of shorts.
It’s worth noting that the long/short ratio in this case is analyzing the percentage of accounts that are long or short, which is typically an indicator of retail sentiment. The long/short ratio has been negative numerous times during the recent move above $100,000 despite staying positive throughout the previous bull market in 2021.
Open interest also rose from $32 billion to $35 billion during this period, indicating that significant capital is being pumped into shorting bitcoin. However, funding rates remained positive throughout this rise, indicating that traders are also entering long positions.

Bitcoin has been trapped in a relatively tight range since early May, trading between $100,000 and $110,000 with three tests of each level of support and resistance.
Technical indicators like relative strength index (RSI) continue to paint a bearish image with several drives of bearish divergence, with RSI weakening on each test of $110,000.
The recent influx of short positions could well be lower timeframe traders capitalizing on the range, shorting resistance before reversing their trade at each test of $100,000.
This rang true on June 22 when the long/short ratio shot up to 1.68 as bitcoin momentarily slumped through $100,000 before bouncing.
There is a potential bull case with the increase in short positions: a short squeeze. This would occur if bitcoin begins to trigger liquidation points and stop losses above a record high, which would cause an impulse in buy pressure and continuation to the upside.
UPDATE JULY 3, 16:21 UTC: Adds context about long/short ratio and a sentence on the funding rate remaining positive.

