This is a daily technical analysis by CoinDesk analyst and Chartered Market Technician Omkar Godbole.
Bitcoin’s BTC spot price has surpassed $111,000 and could rise by another 30% to exceed $140,000.
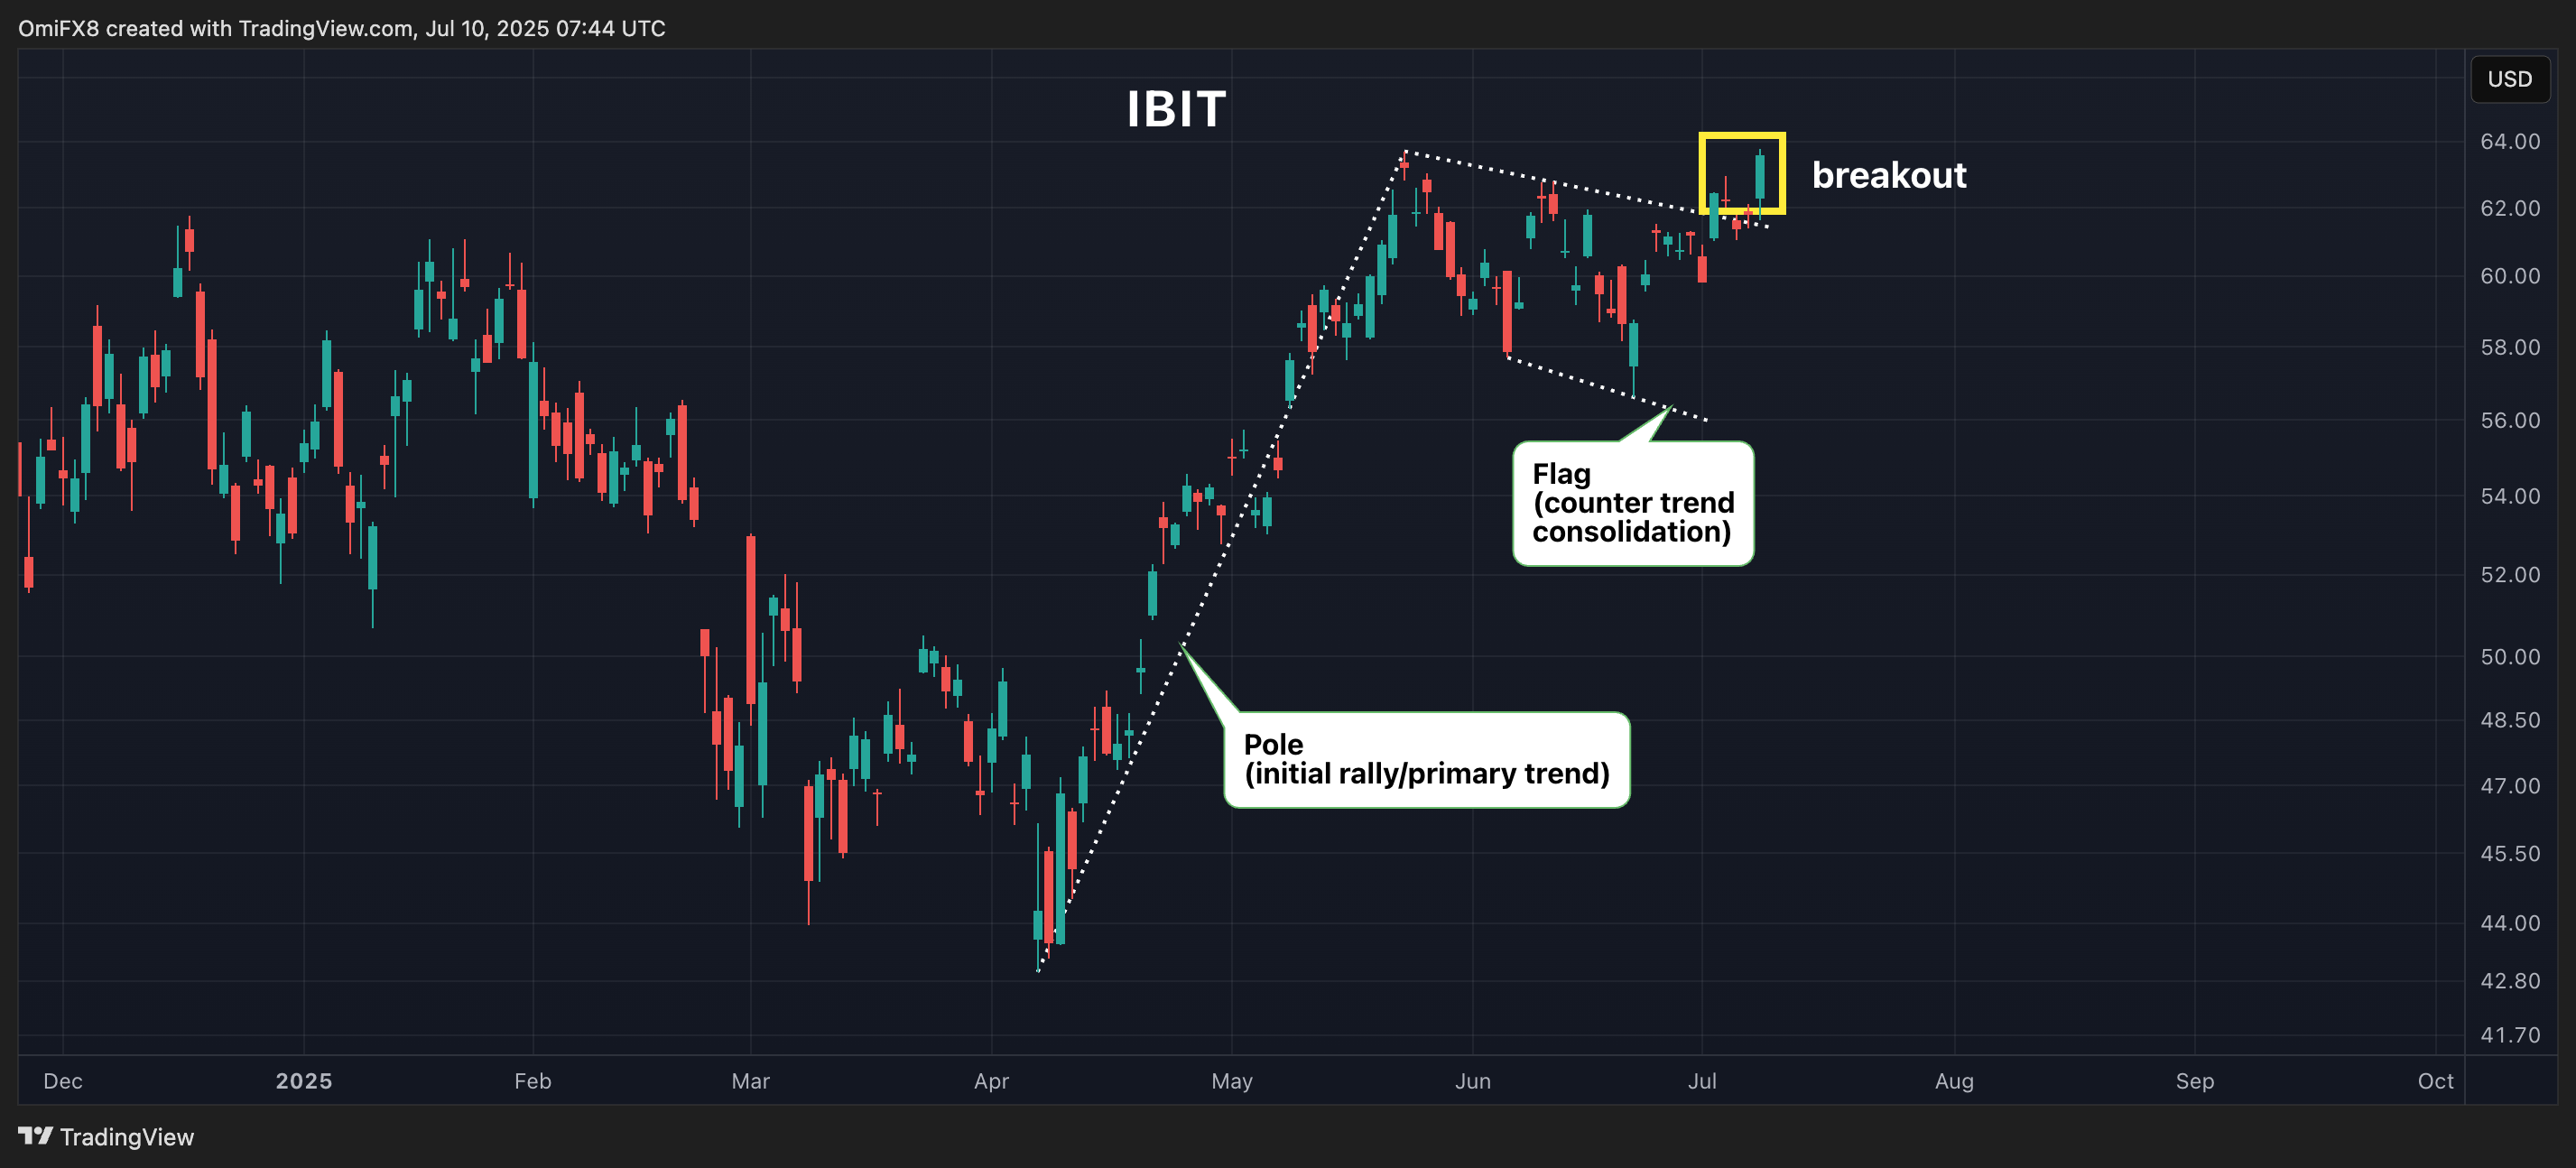
That’s the message from the daily price chart of BlackRock’s Nasdaq-listed spot bitcoin ETF, known by its IBIT ticker, which shows a bull flag breakout.
The ETF, mandated to closely track the BTC spot price, rose 2.85% on Wednesday, briefly surpassing the May high of $63.70, according to data source TradingView.
The advance reconfirmed the flag breakout seen early this month, a sign that the five-and-a-half-week counter-trend consolidation has ended and the broader uptrend from April lows has resumed.
Flags are bullish continuation patterns, and breakouts typically see analysts anticipate a price rally equal to the magnitude of the initial run higher. The so-called measured move method implies at least 30% upside for both IBIT and bitcoin’s spot price.

Flags have a low failure rate, according to technical analysis theory. That said, the pattern could fail if macro factors take a turn for the worse, pushing prices back into a counter-trend consolidation. Such a move would negate the bullish outlook.
As of now, bitcoin’s spot price also indicates a bullish setup, suggesting a potential rally to $134,000, according to veteran chart analyst Peter Brandt.


