

Bitcoin (BTC) traders could be in for another thrilling ride. A key technical indicator that presaged November’s price surge is positioned precisely as it was then, signaling a potential volatility explosion ahead.
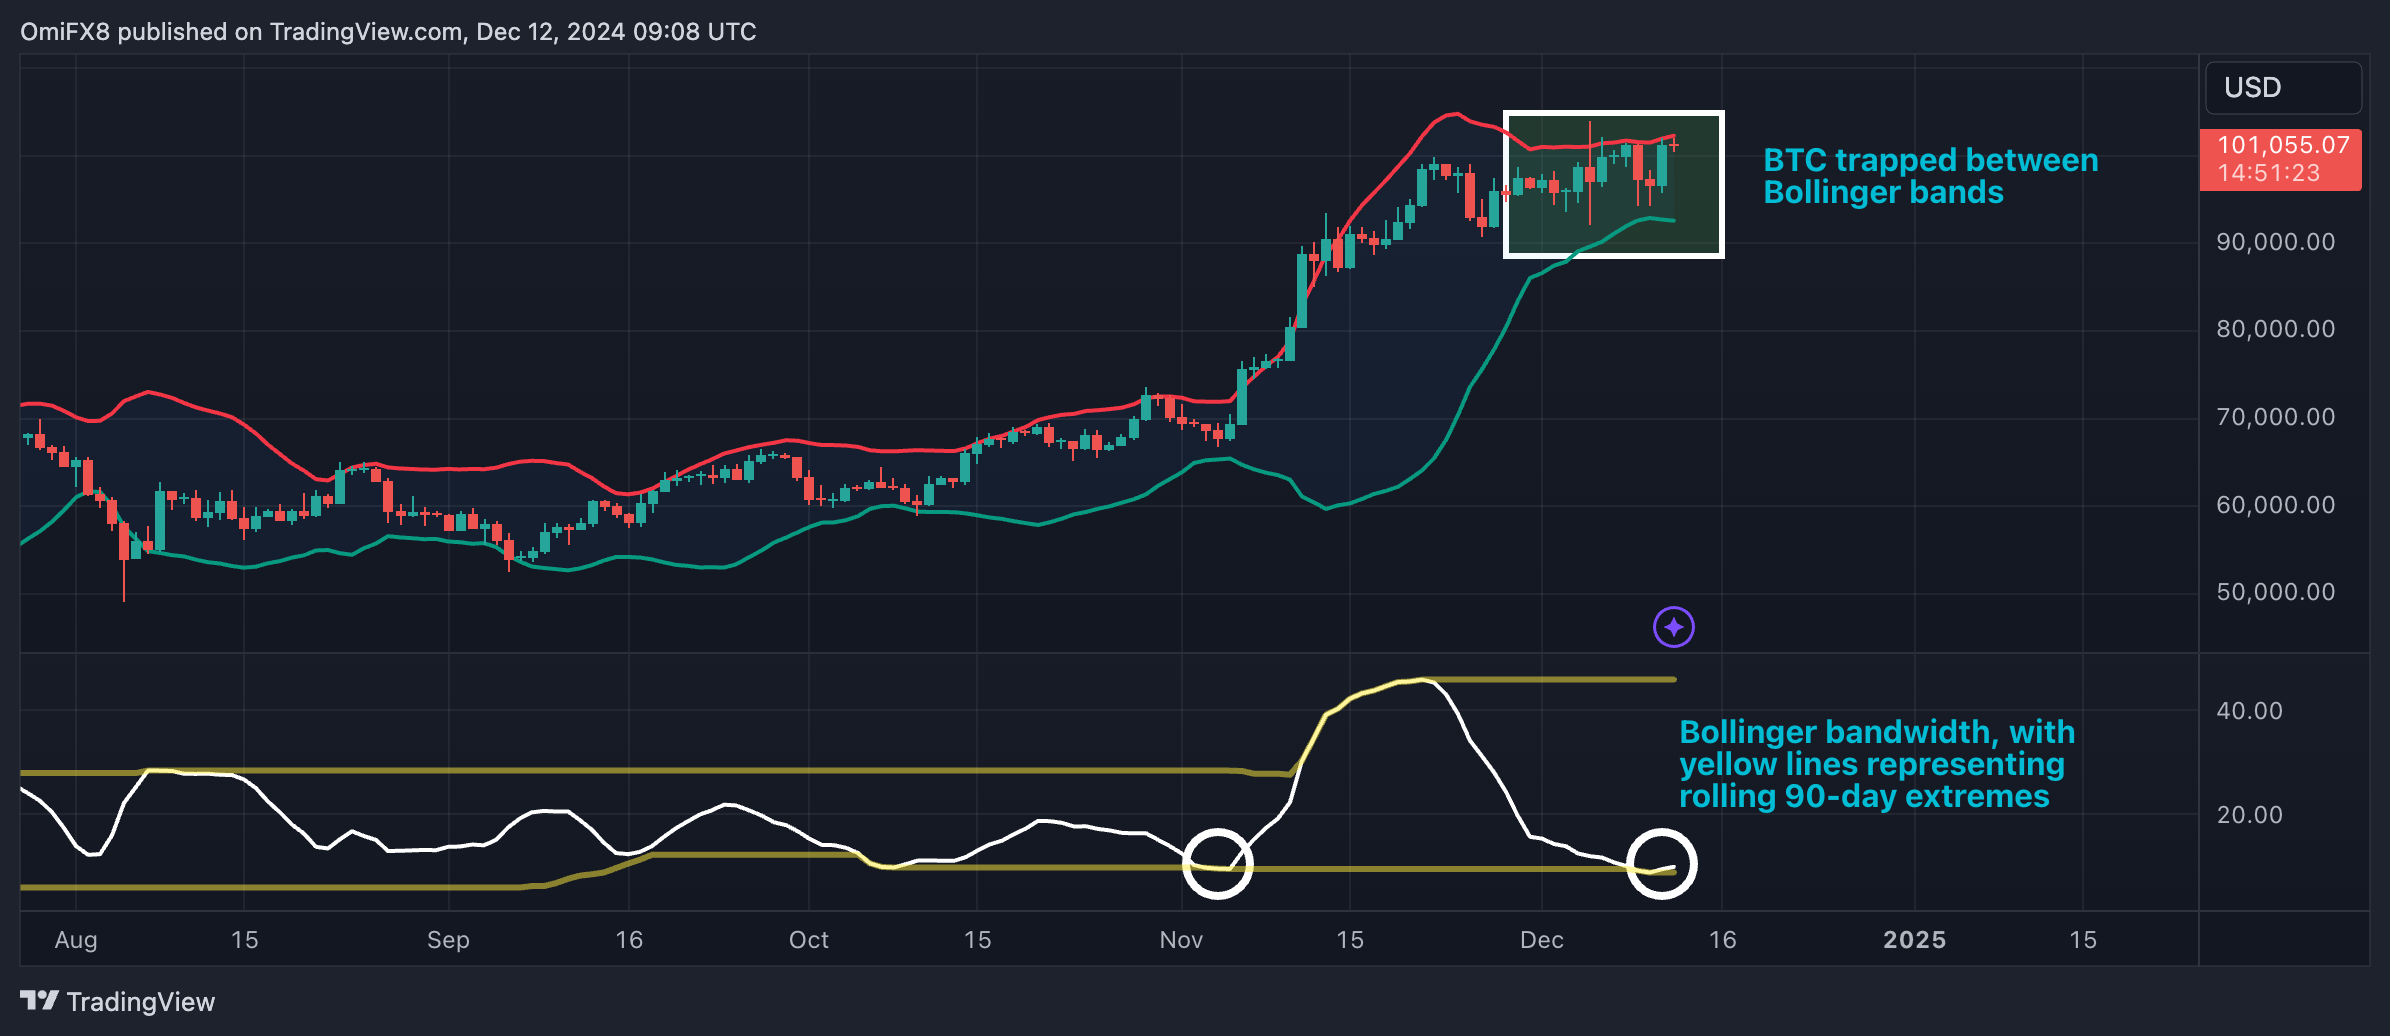
That indicator is the Bollinger bandwidth, a tool used to gauge impending changes in market jumpiness. For bitcoin, the bandwidth has narrowed to less than 10%, a level not seen since Nov. 4, the day before the U.S. elections. The largest cryptocurrency subsequently surged to $100,000 from $70,000 in four weeks.
Bollinger bands mark levels two standard deviations above and below the 20-day moving average of an asset’s price. The bandwidth refers to the spread between upper and lower bands, with rising figures representing volatility boom and vice versa.
Volatility is typically mean-reverting, and historical data shows that when the daily bandwidth drops below 10%, it often leads to upturns followed by increased turbulence. It’s important to note that volatility is price-agnostic, meaning it can manifest in either direction. For example, after the bandwidth dipped below 10% in early June, BTC prices dropped to $54,000 from $69,000 in three weeks.
Seasoned traders wait for the market to confirm a direction by topping either of the two bands. A move above the upper band typically signals a bullish volatility explosion on the horizon, a dip below the lower band suggests the opposite.
At press time, BTC is trading between the two bands, offering little guidance. That said, the prospect of renewed volatility might see savvy traders take derivative bets that profit from increased price swings in either direction.