This is a daily technical analysis by CoinDesk analyst and Chartered Market Technician Omkar Godbole.
Programmable blockchain Solana is on course to flip its rival and leading smart contract blockchain Ethereum in terms of market capitalization, several observers have said it in recent months.
However, for now, Ethereum’s native token ether ETH seems to have an upper hand over Solana’s SOL SOL , according to technical analysis.
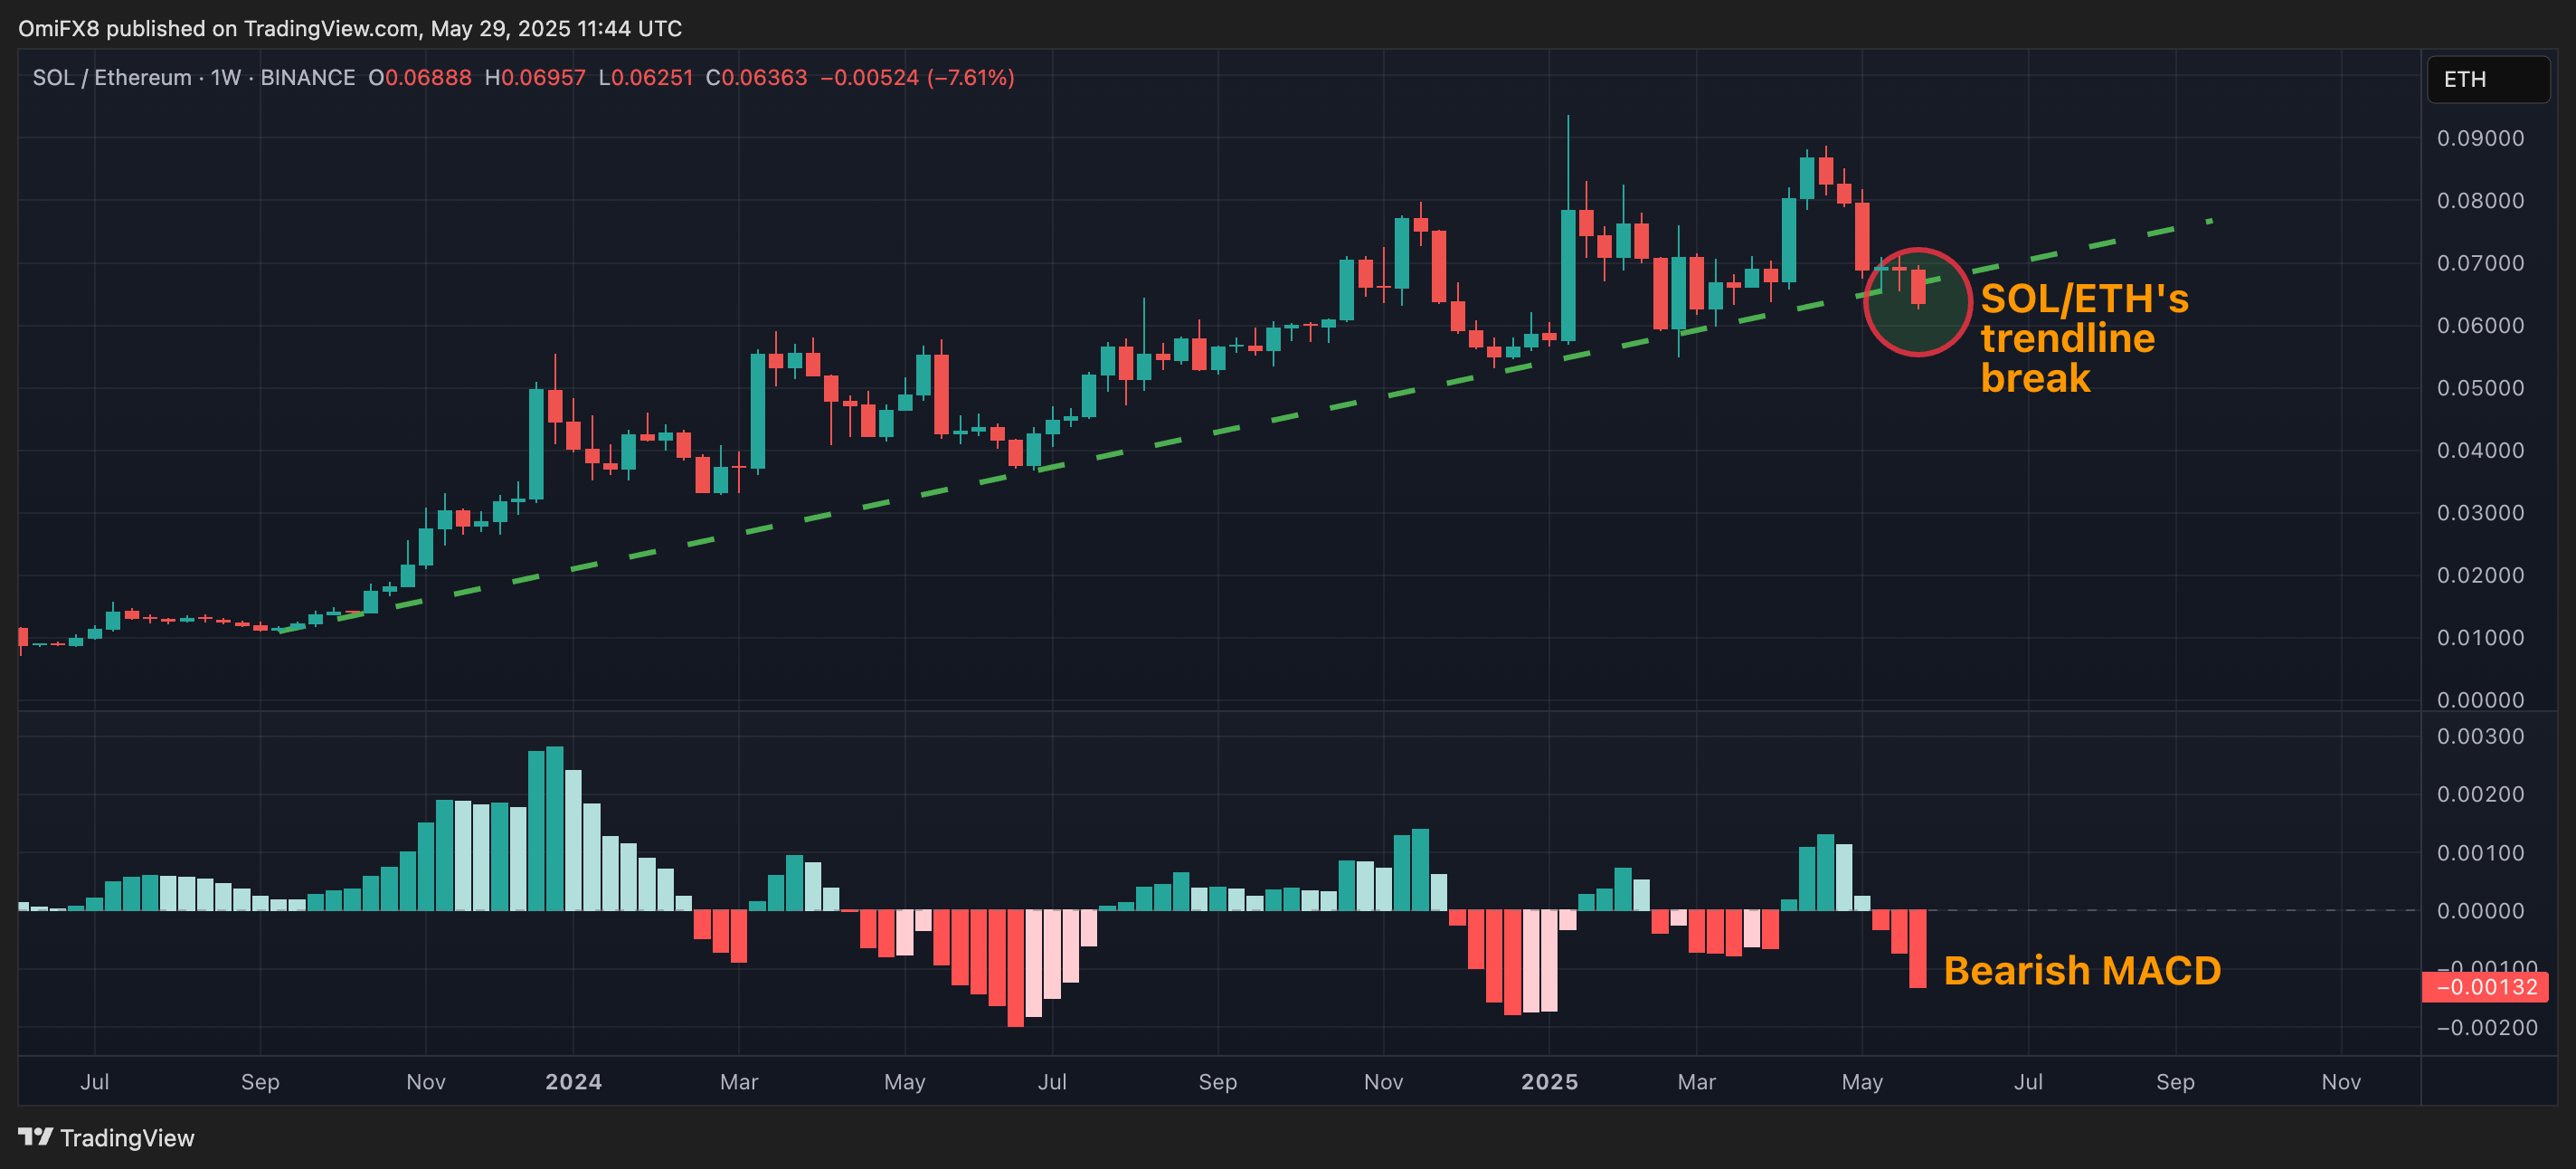
The SOL/ETH ratio has dived out of an upward sloping trendline connecting lows in September 2023, June 2024 and December 2024, per data source TradingView. In other words, tables have turned in ETH’s favor and the token could outperform SOL in the near-term.

Additionally, the weekly chart MACD histogram is printing red, indicating a strengthening of the downside momentum.
The immediate support is seen at 0.055 (the Feb. 25 low). The pair needs to move back above the Ichimoku cloud to negate the SOL bearish outlook.
XRP loses uptrend
Another coin showing a shift in market trend is XRP, the cryptocurrency designed for cross-border payments.
XRP has dived out of a bullish ascending channel, marking the recovery from the early April lows near $1.6.

The breakdown has exposed support at $2, which acted as floor several times early this year. Should the buyers fail to defend that, a deeper slide to $1.60 could be seen.
On the higher side, the recent high of $2.65 is the level to beat for the bulls.

