

The pressing question on crypto traders’ minds is: Has bitcoin’s (BTC) price weakness run its course, or is there more to come?
The former appears to be the case as Monday’s price action, characterized by a swift recovery from intraday lows, contrasted with mid-December when the rally stalled and turned lower from record highs above $108,000.
On Monday, BTC initially fell as investment banks scaled back expectations for Fed rate cuts, with some discussing the potential for rate hikes following Friday’s stellar jobs report, causing prices to dip below the lower end of the key support zone of $90,000-$93,000 as major U.S. stock indices gapped lower.
The breakdown of the support, however, was short-lived, and by the end of the day, BTC had surged back to $94,000, leaving behind a classic “long-legged Doji candle.”
The long wick signifies downtrend exhaustion, indicating that although sellers initially drove prices lower, buyers ultimately overpowered them. This pattern is often seen as a potential signal of a bottom, mainly when it occurs at key support levels or after a notable price drop, as is the case for BTC.
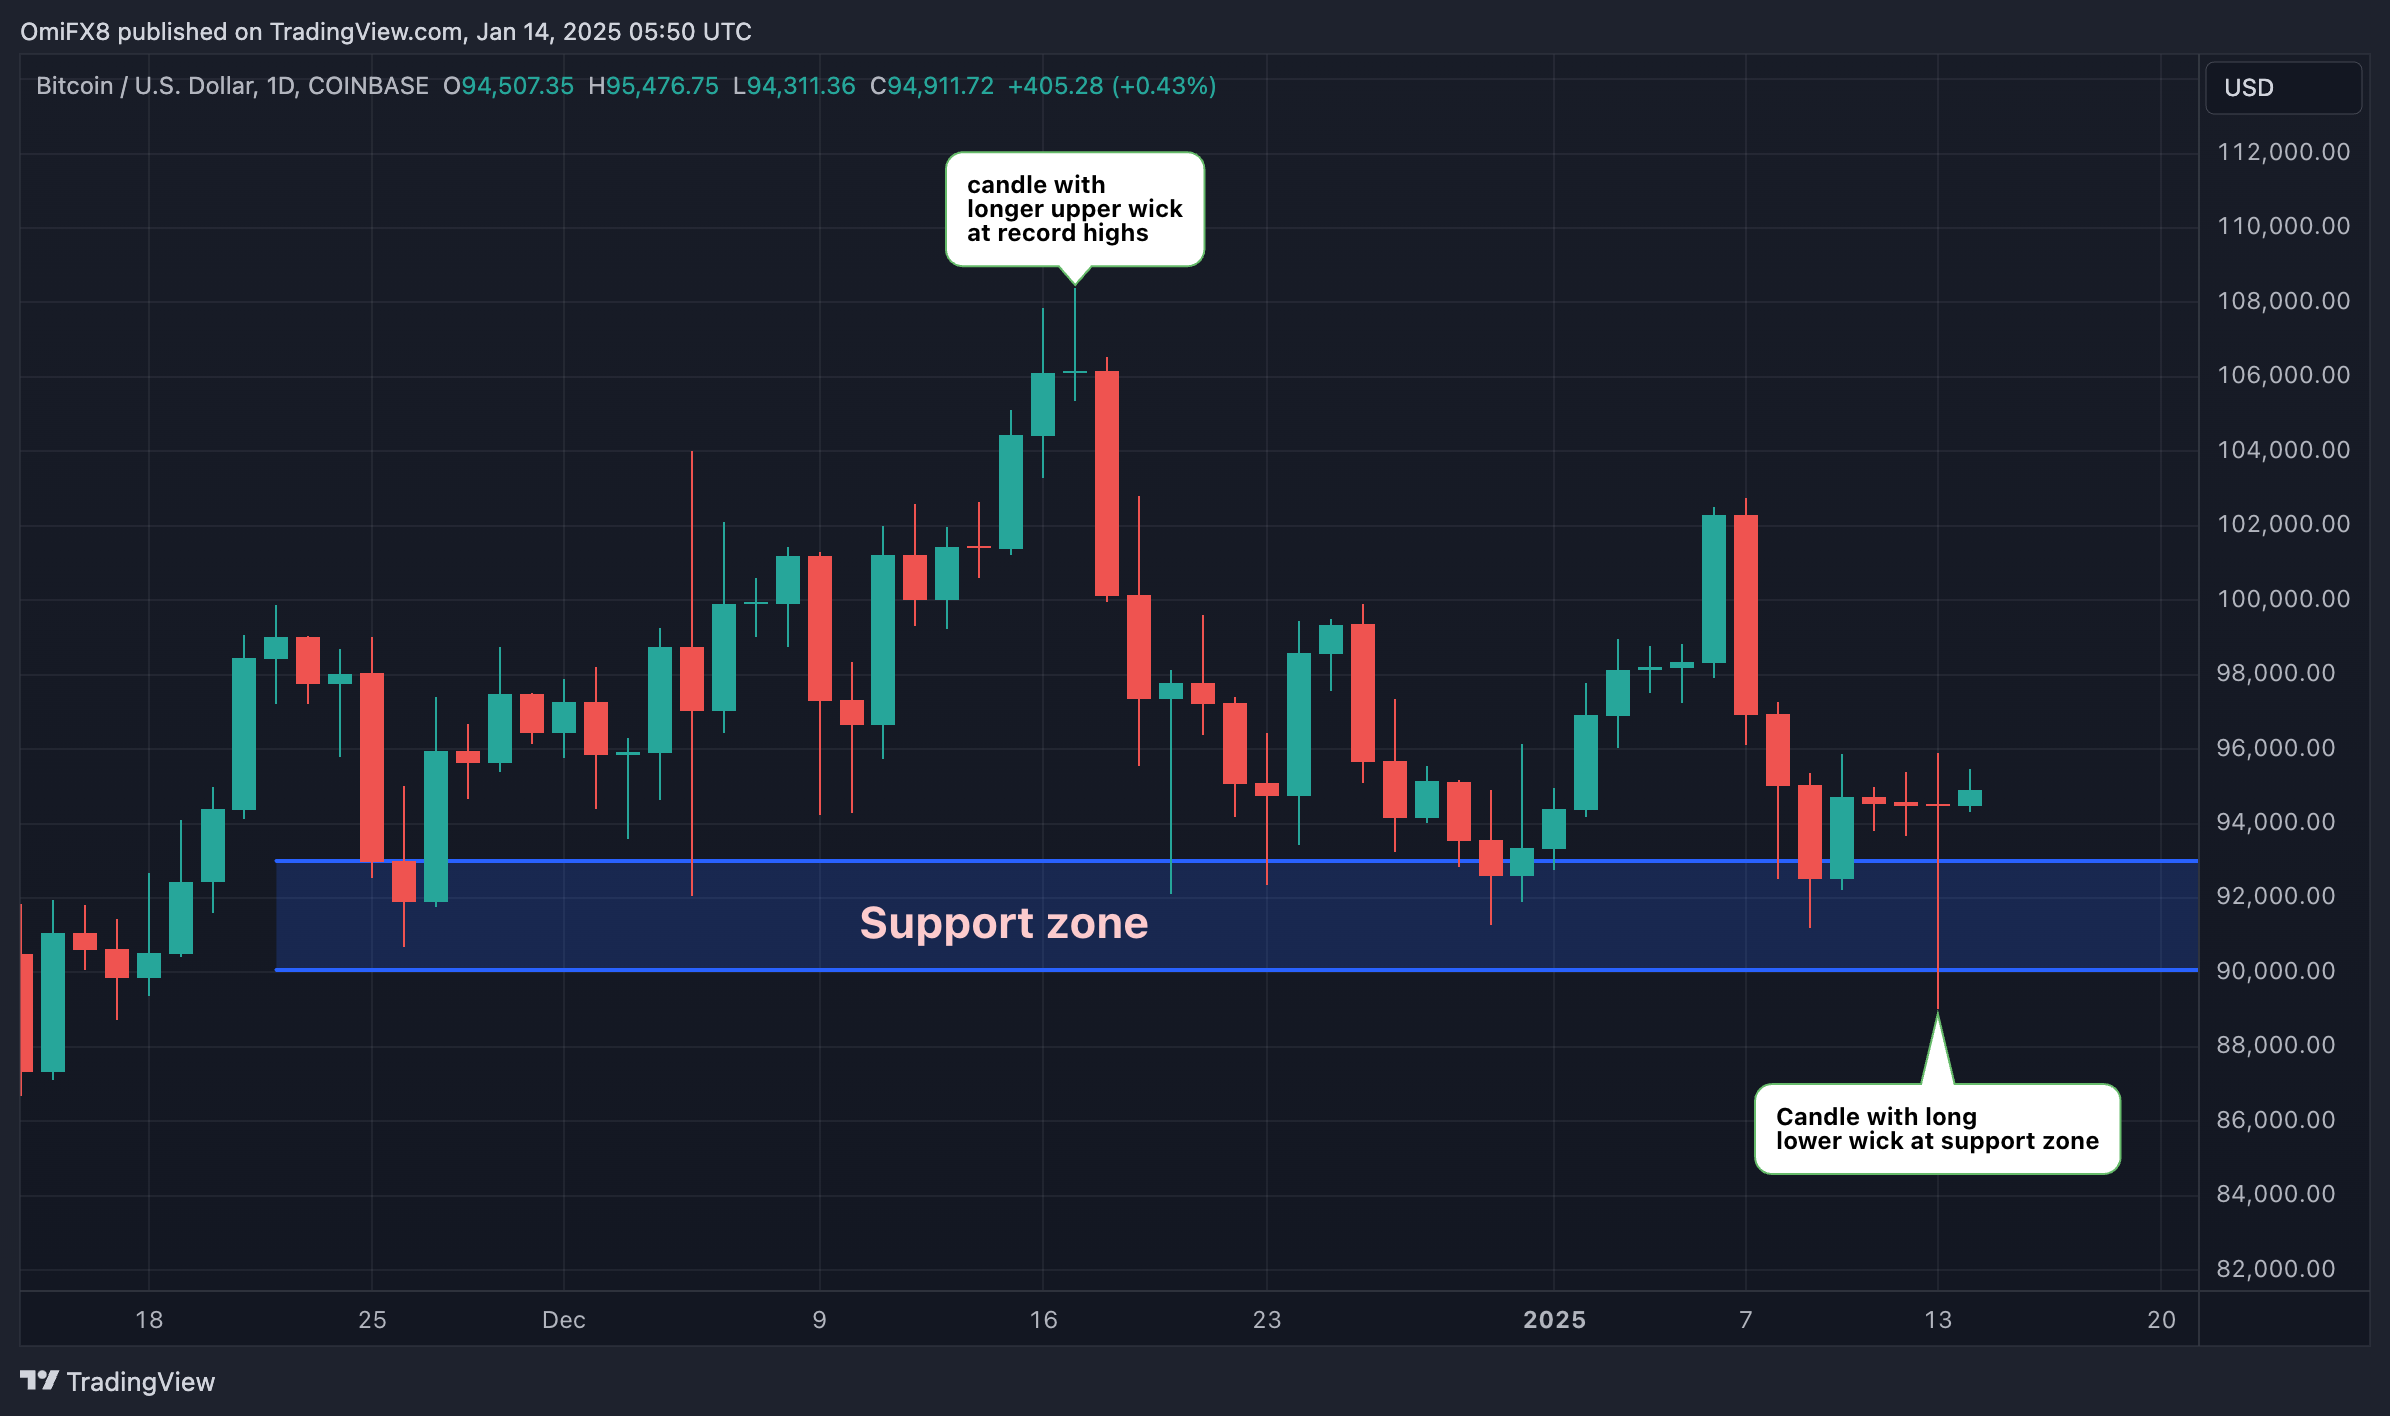
The long-legged doji has emerged at the support zone (horizontal lines) that has consistently restricted the downside since late November.
An inverse of the above is what we saw on Dec. 16 when the bulls failed to keep prices at record highs above $108,000, printing a doji candle with a longer upper shadow. That was a sign of the uptrend running out of steam, with sellers looking to reassert themselves.
What next?
While Monday’s price action hints at a potential bottom, confirmation is required in the form of a decisive move above the day’s high of $95,900.
Chart-driven directional traders typically wait for that before hitting the market with fresh buy orders. Meanwhile, Monday’s low near $89,000 is now the level to beat for the bears.
Note that BTC’s demand-supply dynamics continue to lean bullishly. As Bitwise’s Head of Research – Europe Andre Dragosch pointed out on X, the corporate demand for BTC has already outpaced the supply of new coins this year.
Price volatility may pick up again on the back of Wednesday’s U.S. CPI report, which could influence Fed rate cut expectations.
“After Monday’s sharp drop, Bitcoin rebounded from a low of $89K, as traders await the U.S. CPI report on Jan. 15. Major altcoins followed suit, with many losing more in the last 24 hours,” Neal Wen, head of global business development at Kronos Research, told CoinDesk.
“Market watchers are now focused on signs of stability to see further downside or upside,” Wen added.