

“You’re not bullish enough!” an XRP enthusiast exclaimed on X last week after Ripple, which utilizes the token for cross-border transactions, announced that the U.S. Securities and Exchange Commission has dropped its case against them.
Many others share this excitement, and understandably so, as the conclusion of this long-standing legal battle has lifted a weight that hindered XRP’s performance compared to the broader market during the 2021 bull run. Plus, there is XRP ETF hype and hopes that the token could become a part of the U.S. strategic reserve.
That said, the recent price action does not reflect the above optimism, with key momentum indicators flashing a major bearish shift in trend, warning of a notable price slide ahead.
XRP surged over 11% to $2.59 last Wednesday, cheering the SEC news. Since then, the follow through has been anything but bullish with prices rangebound between $2.30-$2.50, despite optimism that expected reciprocal trade tariffs from President Donald Trump on April 2 could be more measured than initially expected.
Three-line break chart
The first indicator signaling bearish trend reversal is the three-line break chart, which focuses only on price movements while filtering out short-term noise, helping identify trend changes as suggested by the market and not arbitrary/discretionary trading rules.
The chart consists of vertical blocks called lines or bars (green and red). A bull reversal happens when a green bar occurs with prices moving higher than the highest point of the last three red bars. On the contrary, a bearish shift is represented by the emergence of a new red bar that goes beyond the lowest point of the previous three green bars.
In XRP’s case, a new red bar occurred early this month in the weekly time frame and has held intact following the SEC news. The “weekly” aspect means this chart aggregates price information over a week.
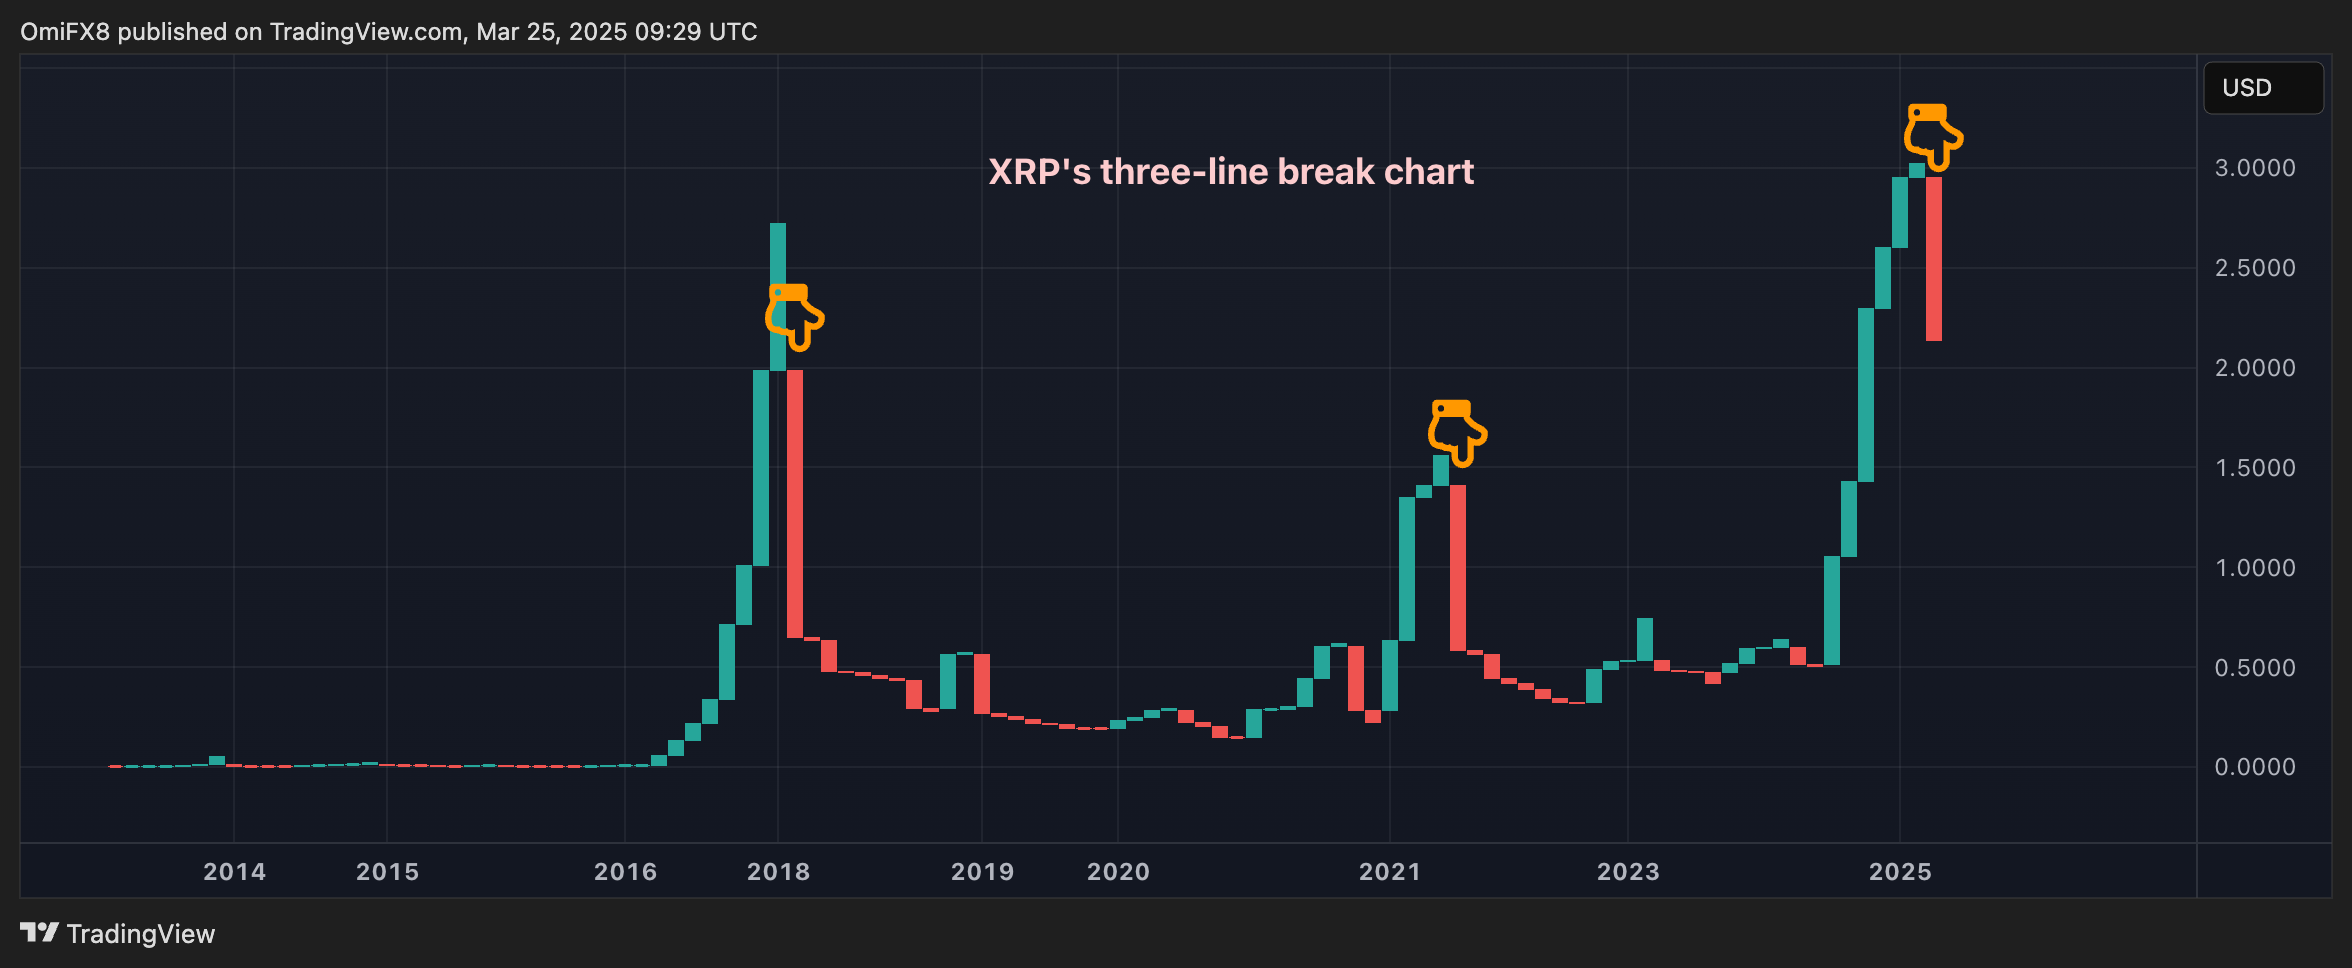
The new red bar indicates a bullish-to-bearish shift in momentum. Similar patterns characterized the beginnings of prolonged bear markets in 2021 and early 2018.
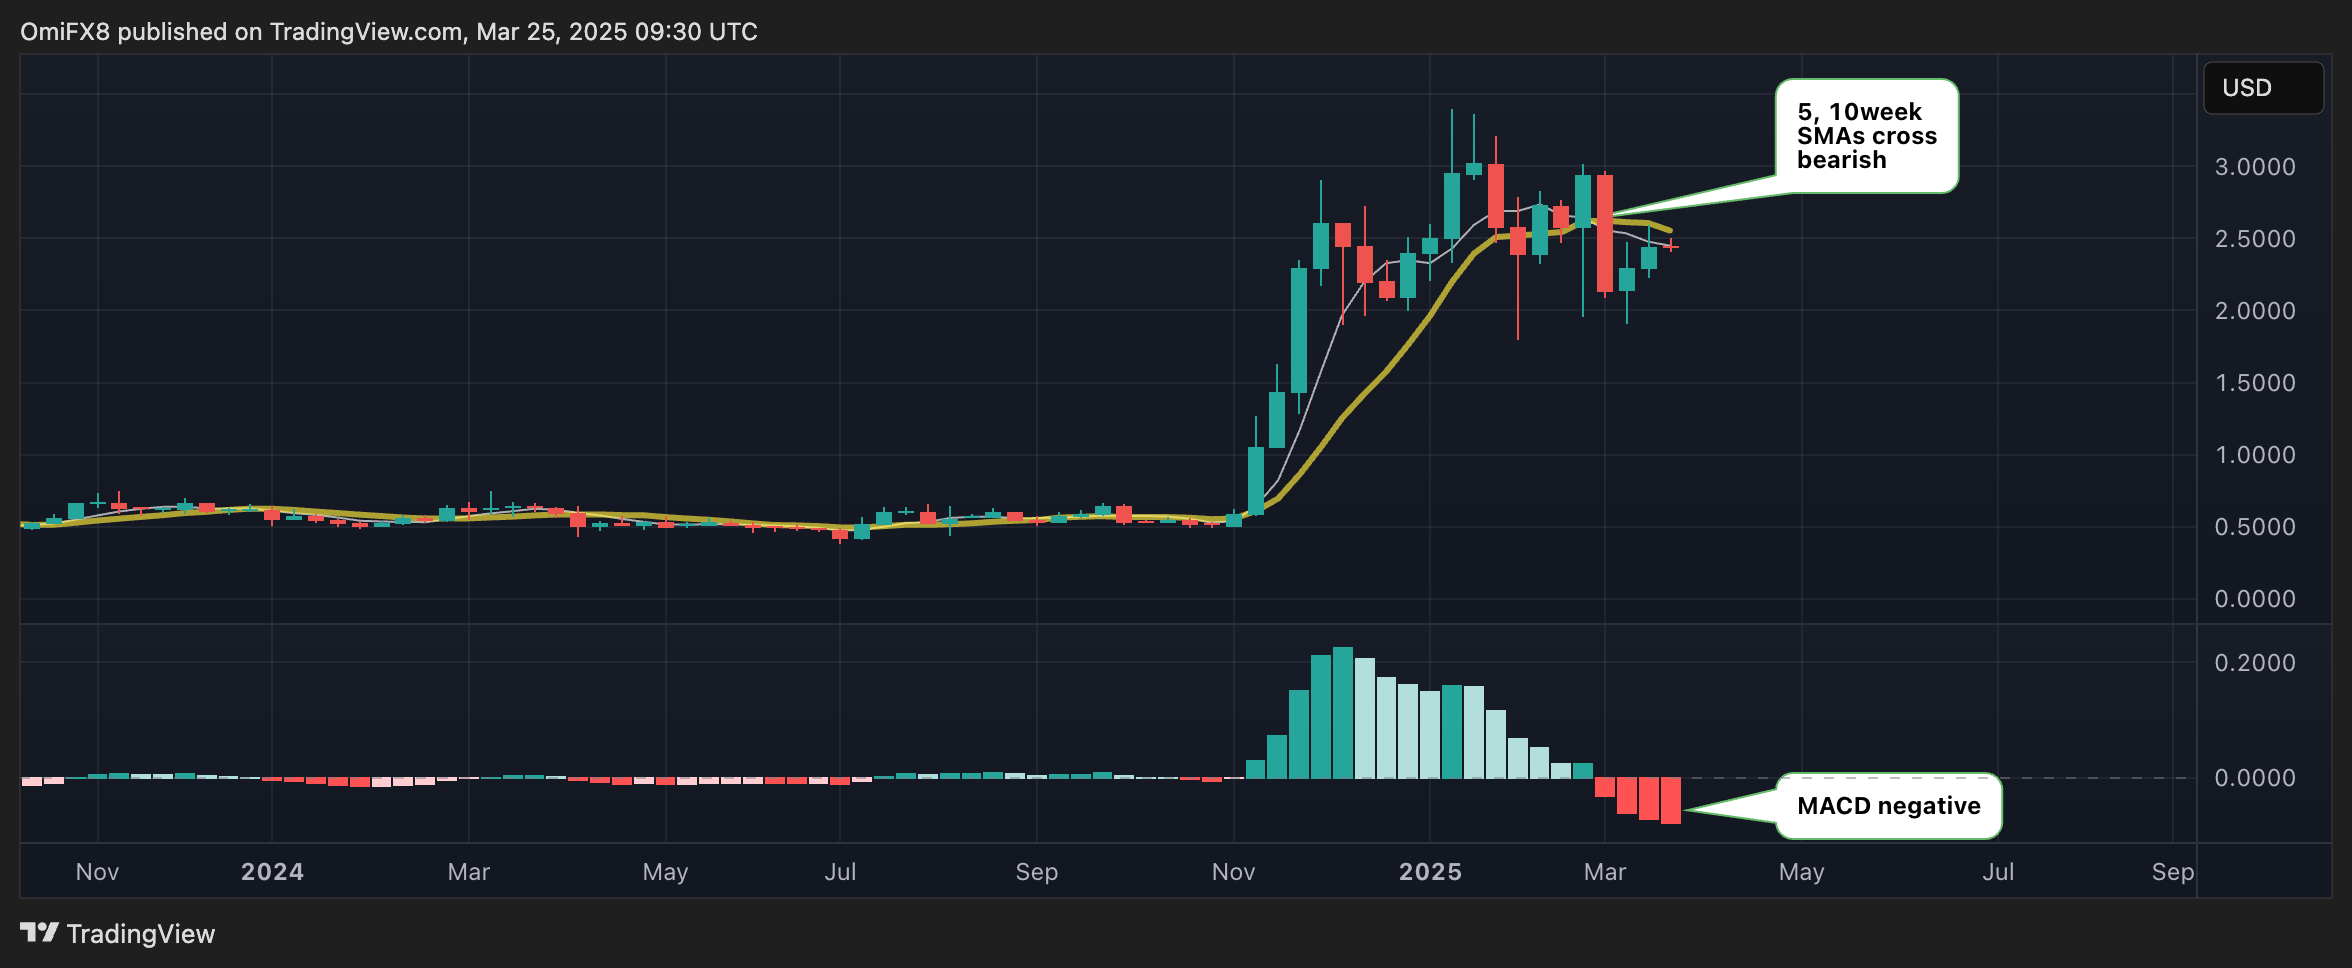
MACD
The moving average convergence divergence (MACD) histogram, used to gauge trend strength and trend changes, is producing deeper bars below the zero line on the weekly chart. It’s a sign of the strengthening of the downside momentum.
The same indicator flipped positive in November, after which prices surged from $1 to above $3.
The 5- and 10-week simple moving averages (SMAs) have crossed bearish as well, suggesting the path of least resistance is to the downside.
Bollinger Bands
The Bollinger bands – volatility bands placed two standard deviations above and below XRP’s 20-week SMA – have widened in response to the sharp price rally in late 2024 and early this year.
Historically, prices have tended to move lower following the sharp widening of the Bollinger bands, as observed after mid-2021 and early 2018.

When bullish?
A firm move of $3, the high registered on March 2, would invalidate the bearish setup, negating the lower highs pattern to suggest a renewed bullish technical outlook.
Some analysts expect XRP to reach as high as $10 by the end of this decade.
