

Wednesday could be a pivotal day for financial markets, including cryptocurrencies, as President Donald Trump is expected to announce sweeping reciprocal tariffs to “liberate” the U.S. from the supposed unfair practices of its trading partners.
Ahead of the pivotal announcement, signs of downtrend exhaustion have emerged in the ether (ETH) market. Yes, you read that right: after having lagged BTC by a large margin through the two-year bull crypto bull run, ETH may take the lead if the looming tariffs are more measured than expected.
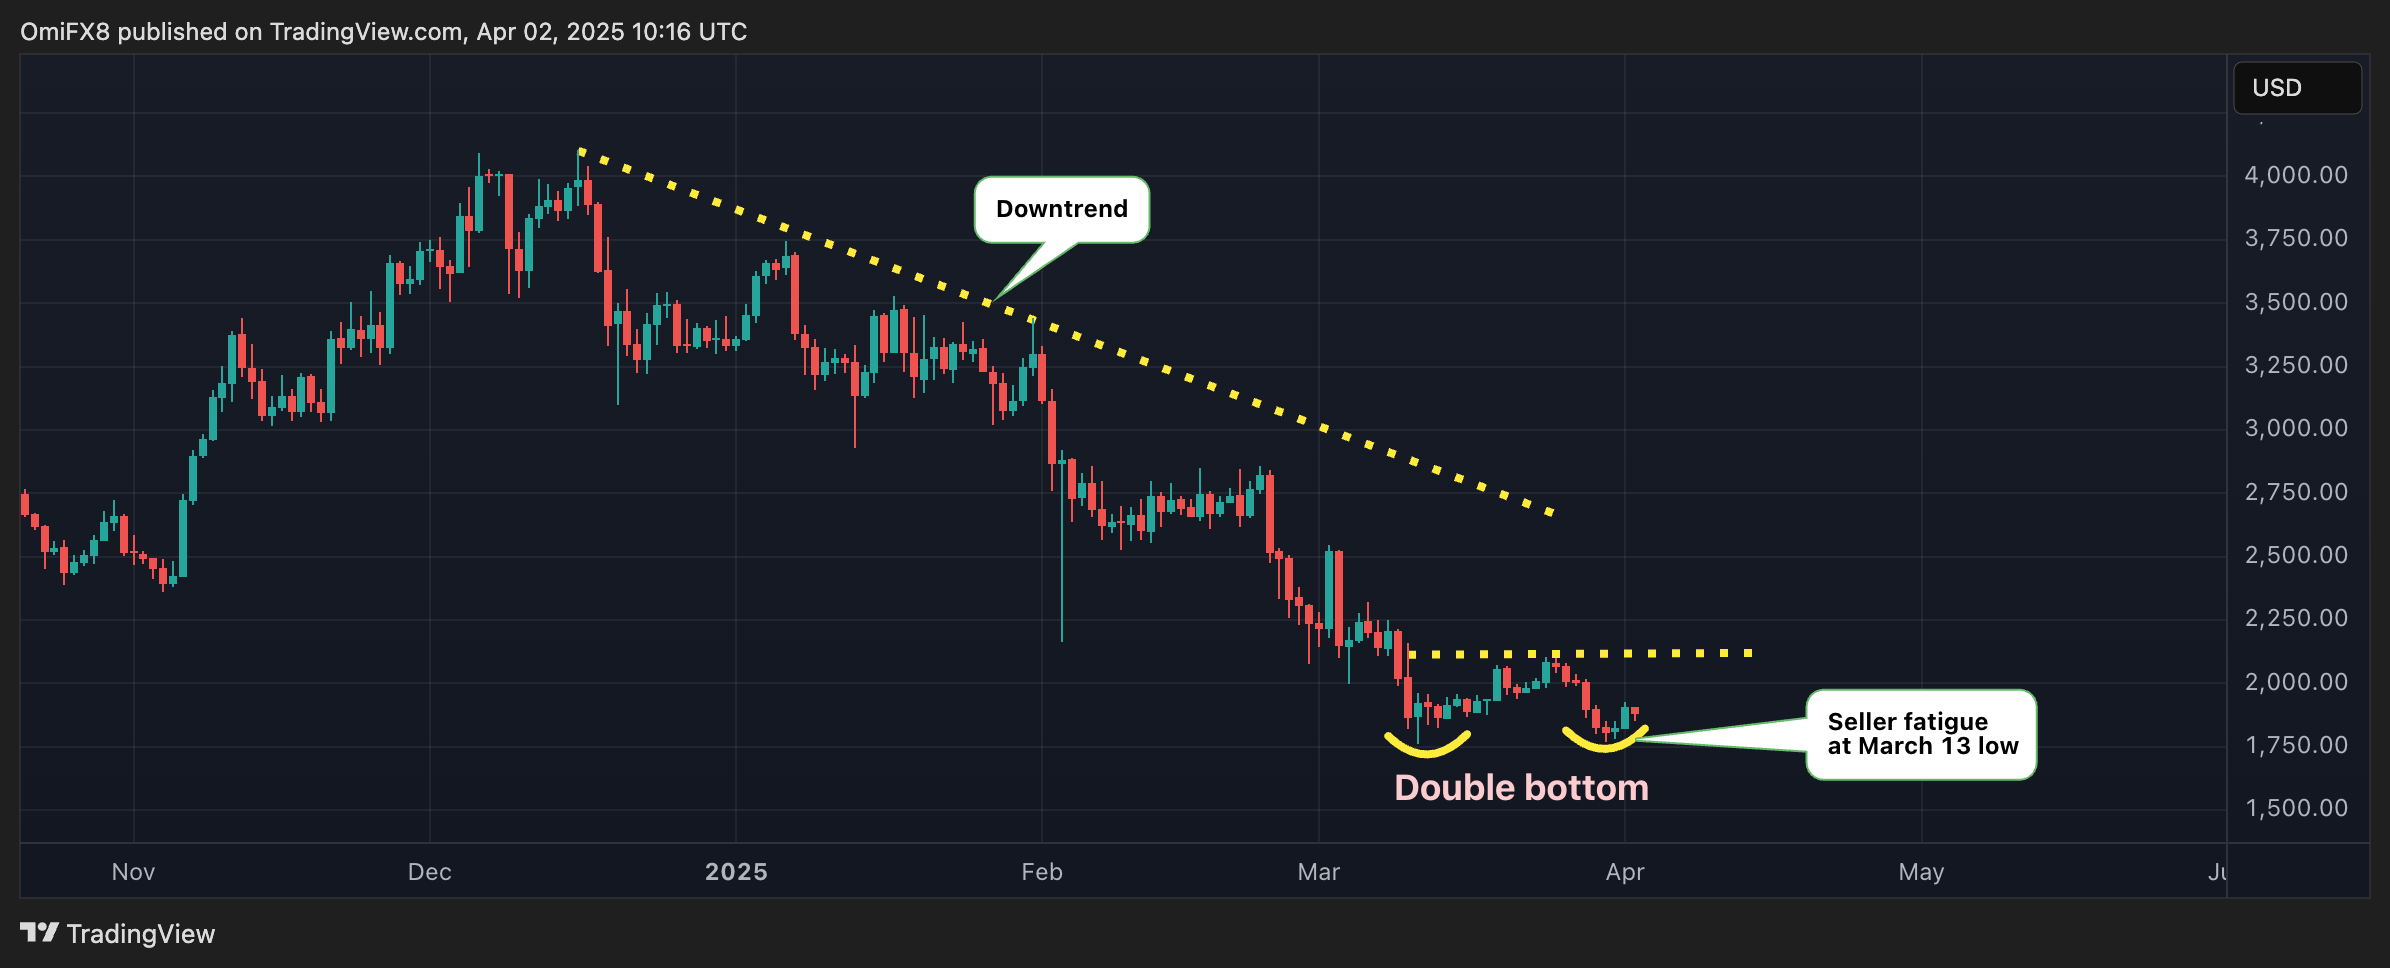
Seller fatigue at March lows, potential double bottom
Ether fell along with bitcoin last week, but the bears failed to penetrate the 16-month low of $1,755 hit on March 11. That’s the first sign of seller fatigue or downtrend exhaustion.
Since then, prices have bounced to $1,880, teasing a double bottom formation with the neckline resistance at $2,104. A move through that would confirm the bullish breakout, opening doors for $2,400, the level identified as the next resistance per the measured move method.
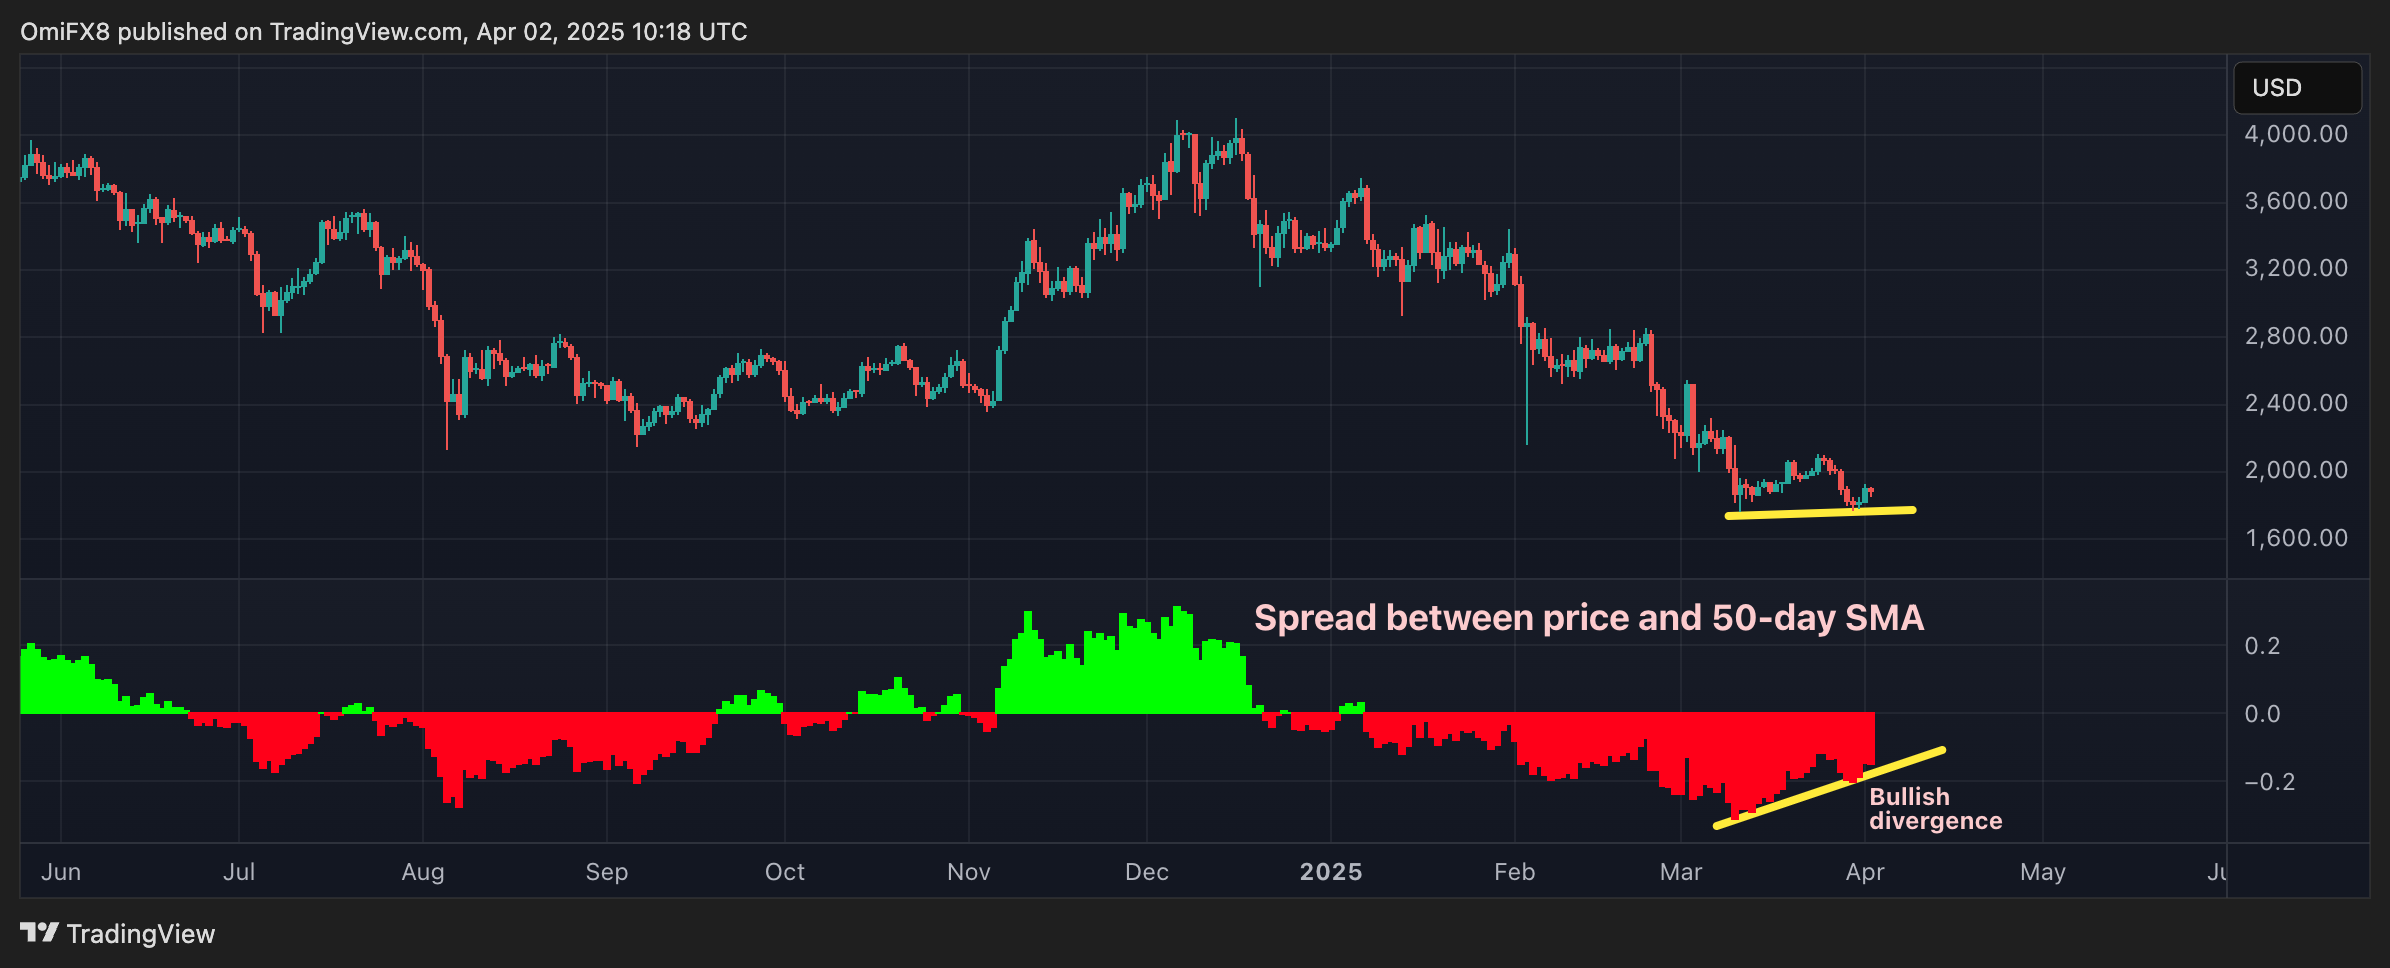
Bullish divergence
While prices revisited the low from March 11 last week, the histogram that represents the spread between the price and its 50-day simple moving average (SMA) did not follow suit and carved put a higher low.
The divergence suggests that although prices fell, the momentum behind the downward price movement weakened.
Line break flips bullish
After a prolonged downtrend that saw prices halve to $2,000, the three-line break chart has now flipped bullish, marking a significant shift in market sentiment. This change is illustrated by the appearance of a green bar on the daily time frame, indicating a potential reversal in price momentum.
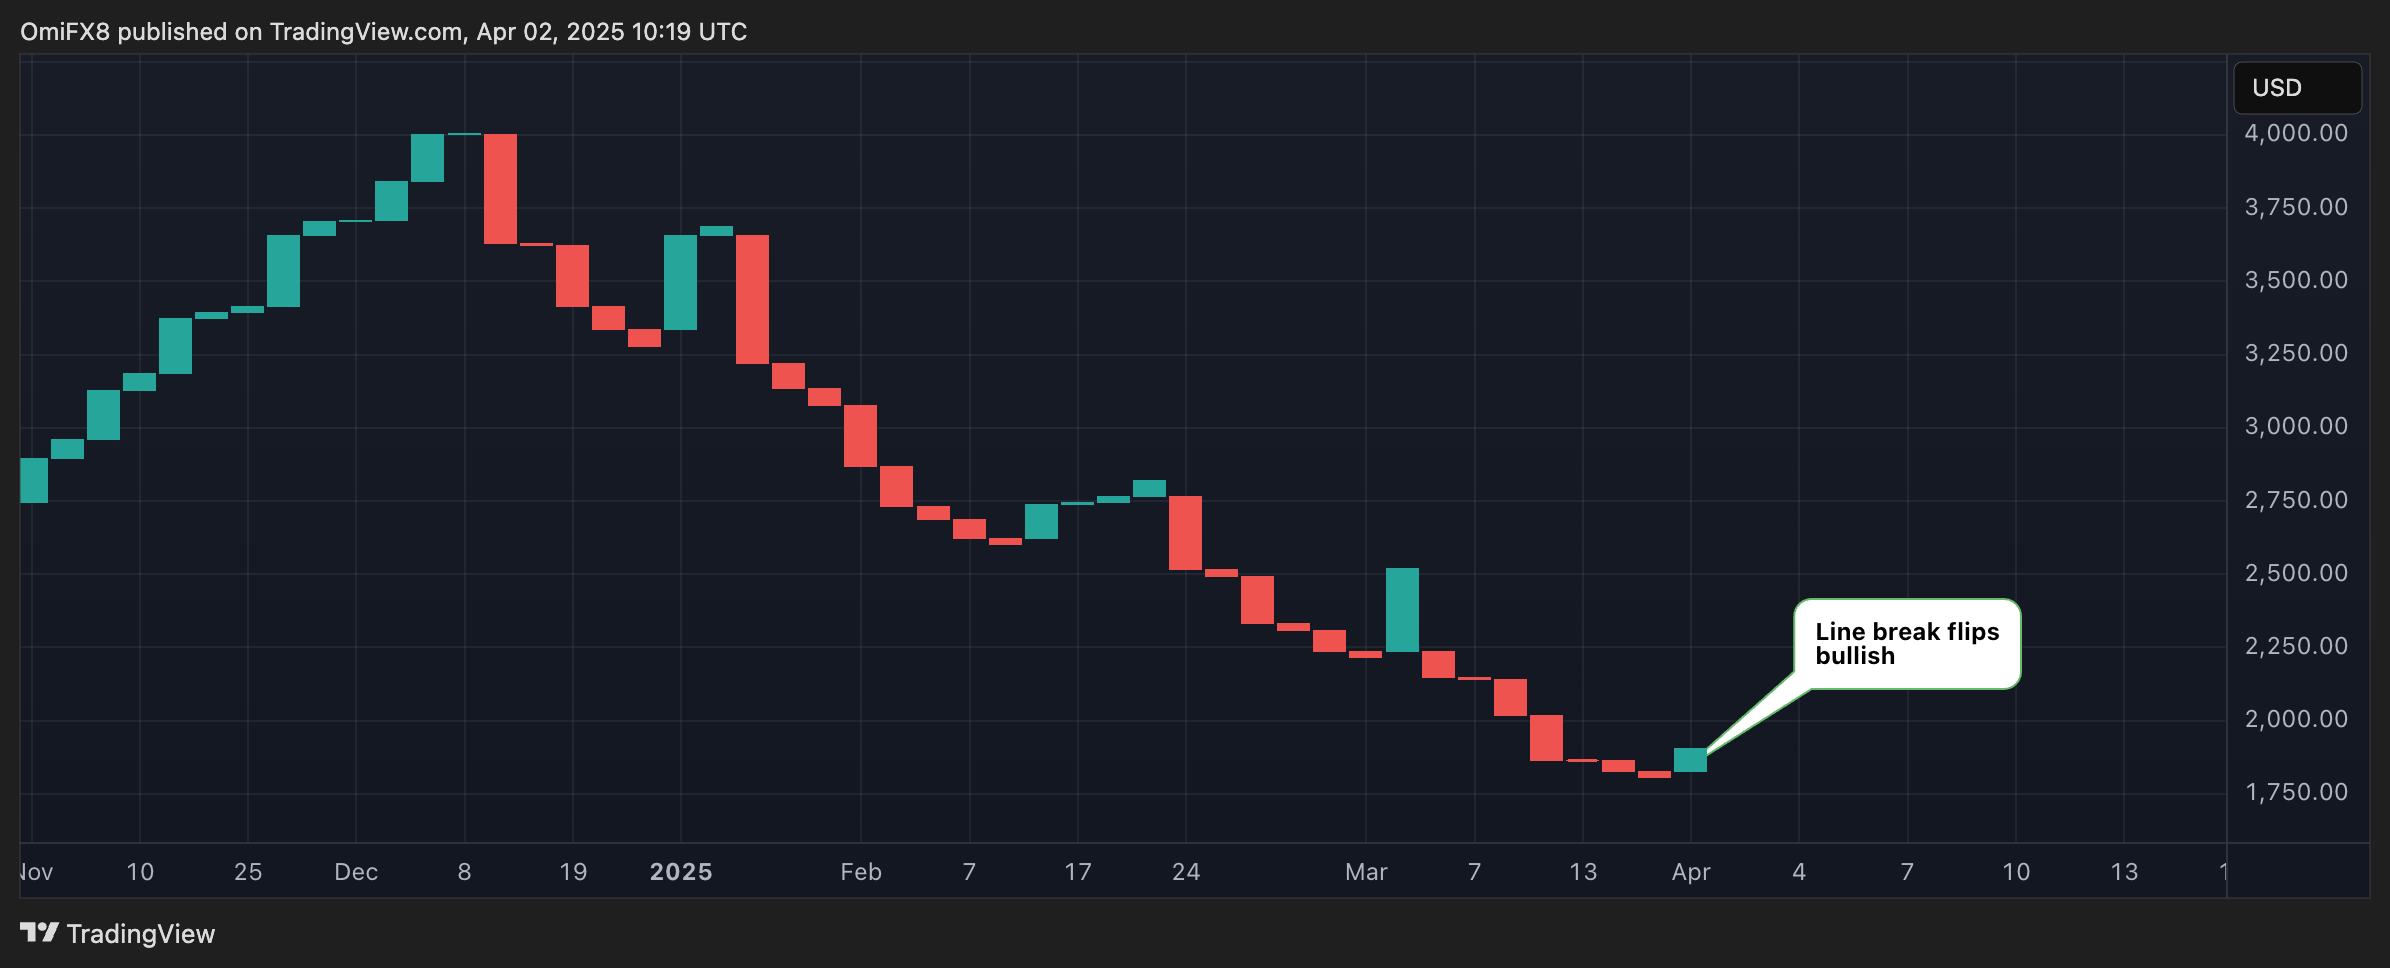
The line break’s previous bullish signal from early March was short-lived and turned out to be a bear trap. Still, the latest bullish flip appears more reliable as it is accompanied by signs of downtrend exhaustion on candlestick charts discussed above.
That said, macro factors can single handedly make or break charts, meaning broad-based risk aversion on the back of Trump tariffs could invalidate all the bullish signals discussed above, potentially leading to deeper losses in ether.