This is a daily analysis of top tokens with CME futures by CoinDesk analyst and Chartered Market Technician Omkar Godbole.
Bitcoin: Looks north; Dealer gamma, Vol and DXY in focus
Bitcoin (BTC) just shattered records, surging past $123,000 early Monday, continuing the march to $140,000 levels indicated by the strong breakout in BlackRock’s IBIT last week.
There’s every reason to be incredibly bullish here as we face a “Goldilocks” moment for bitcoin: a pro-crypto U.S. President calling for ultra-low interest rates against the backdrop of fiscal splurge and stock market highs. It’s an unprecedented alignment of bullish BTC factors.
Price charts show no signs of popular indicators like the relative strength index (RSI) and the moving average convergence/divergence (MACD) diverging bearishly and major averages, 50-, 100- and 200-day simple moving average (SMAs) remain stacked bullishly one above the other on daily and intraday charts.
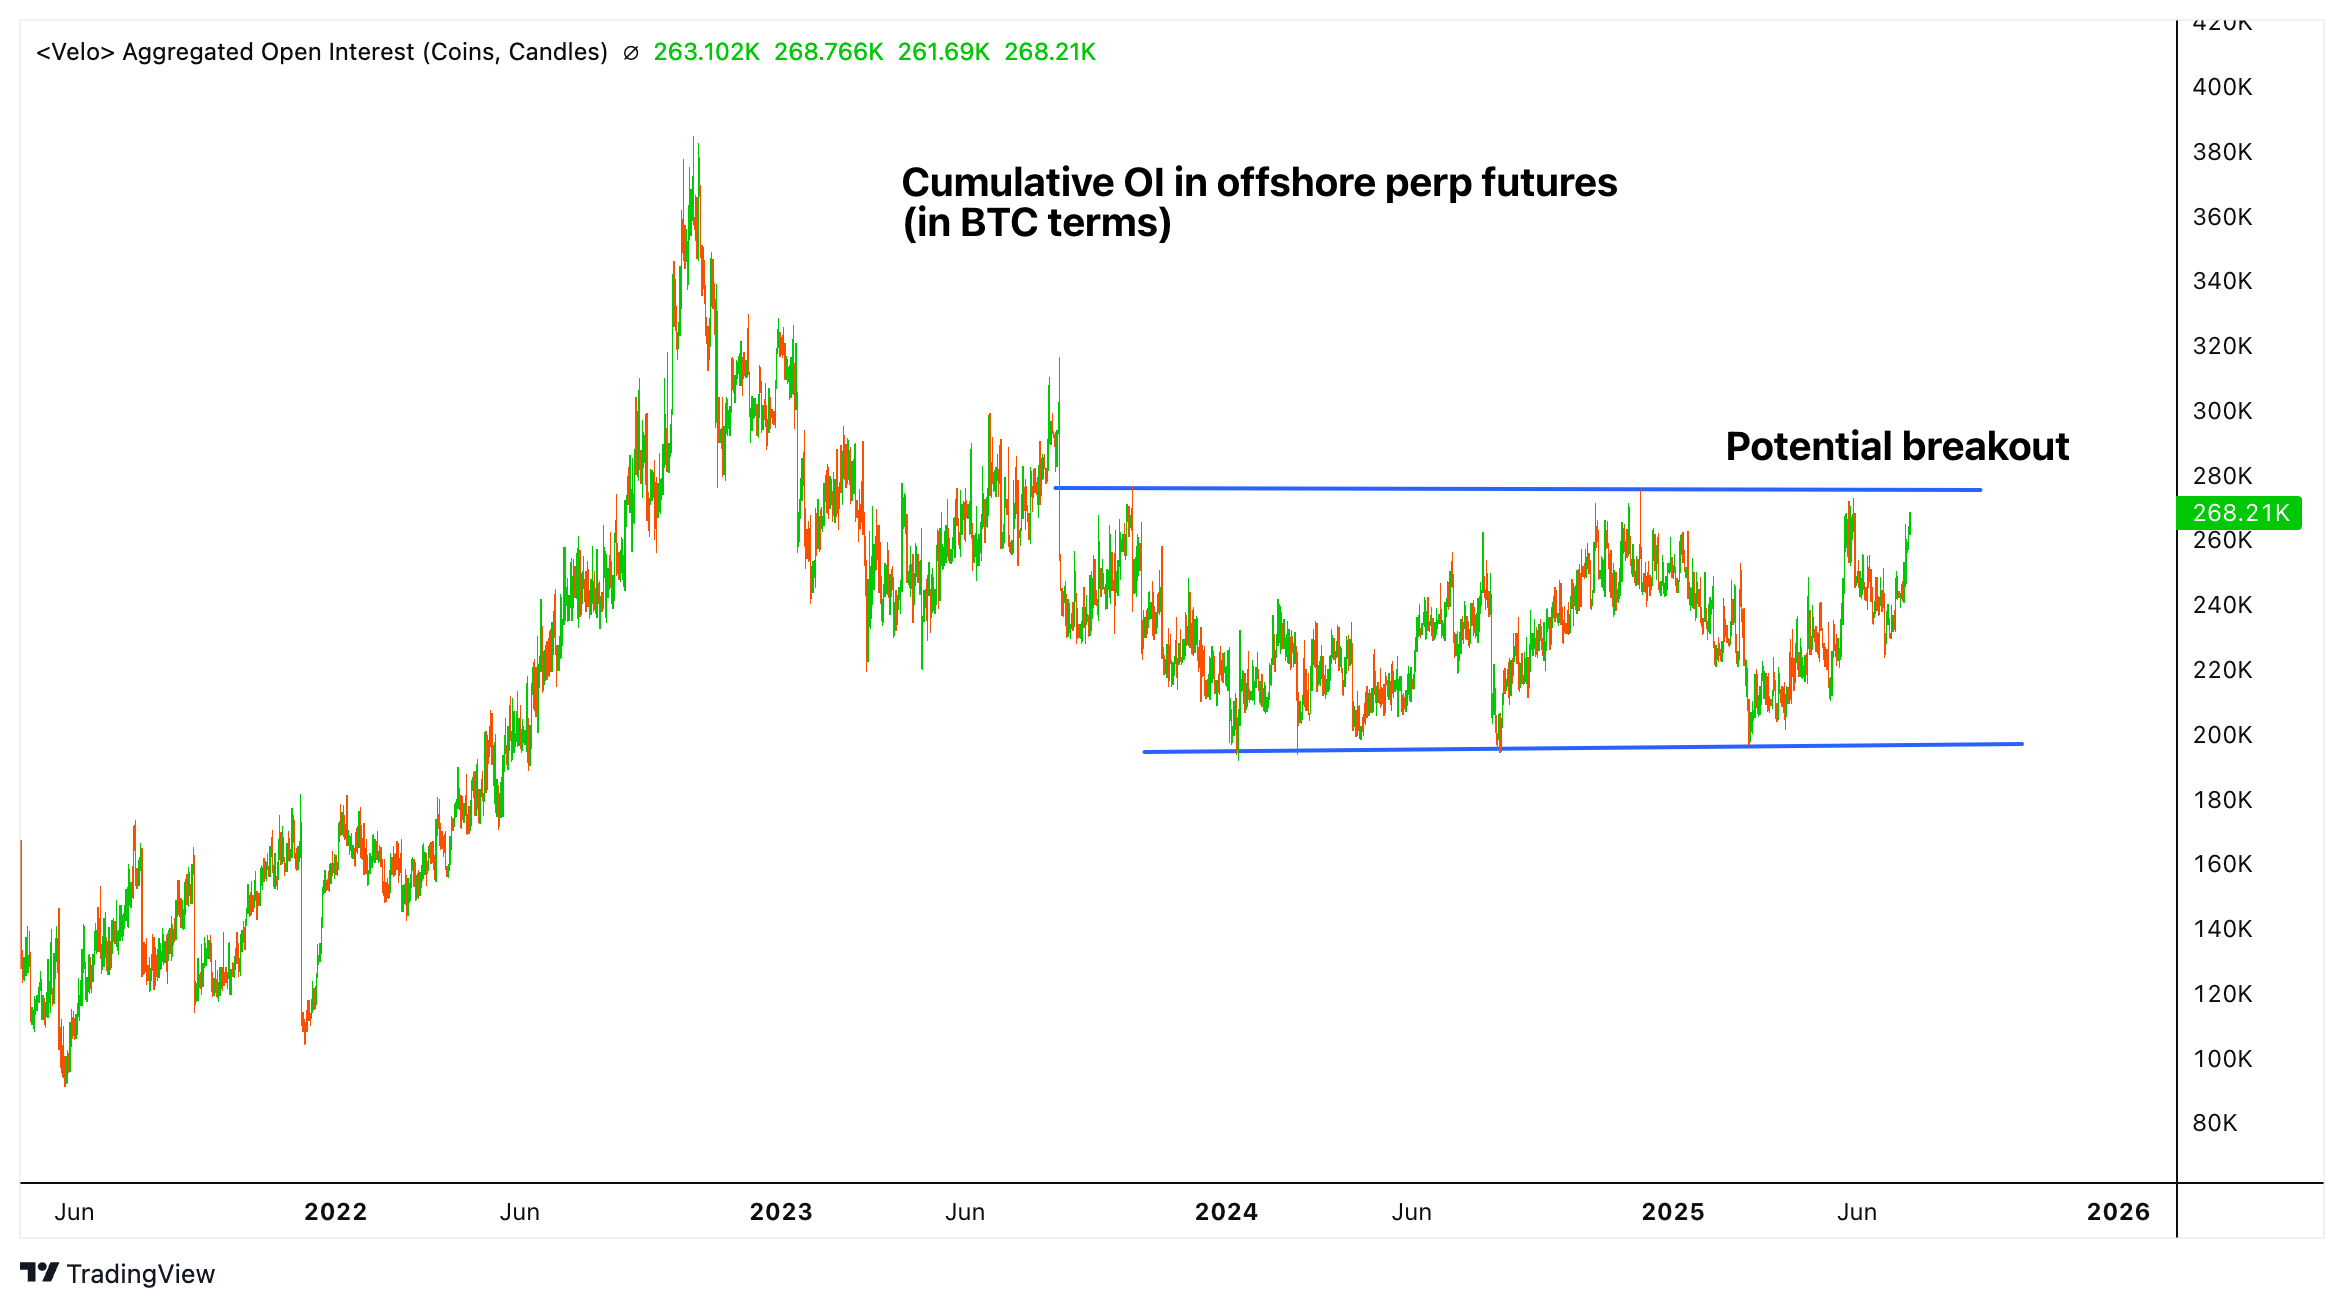
Watch out for a breakout in the cumulative open interest in BTC perpetual futures listed on offshore exchanges as an additional bullish development.
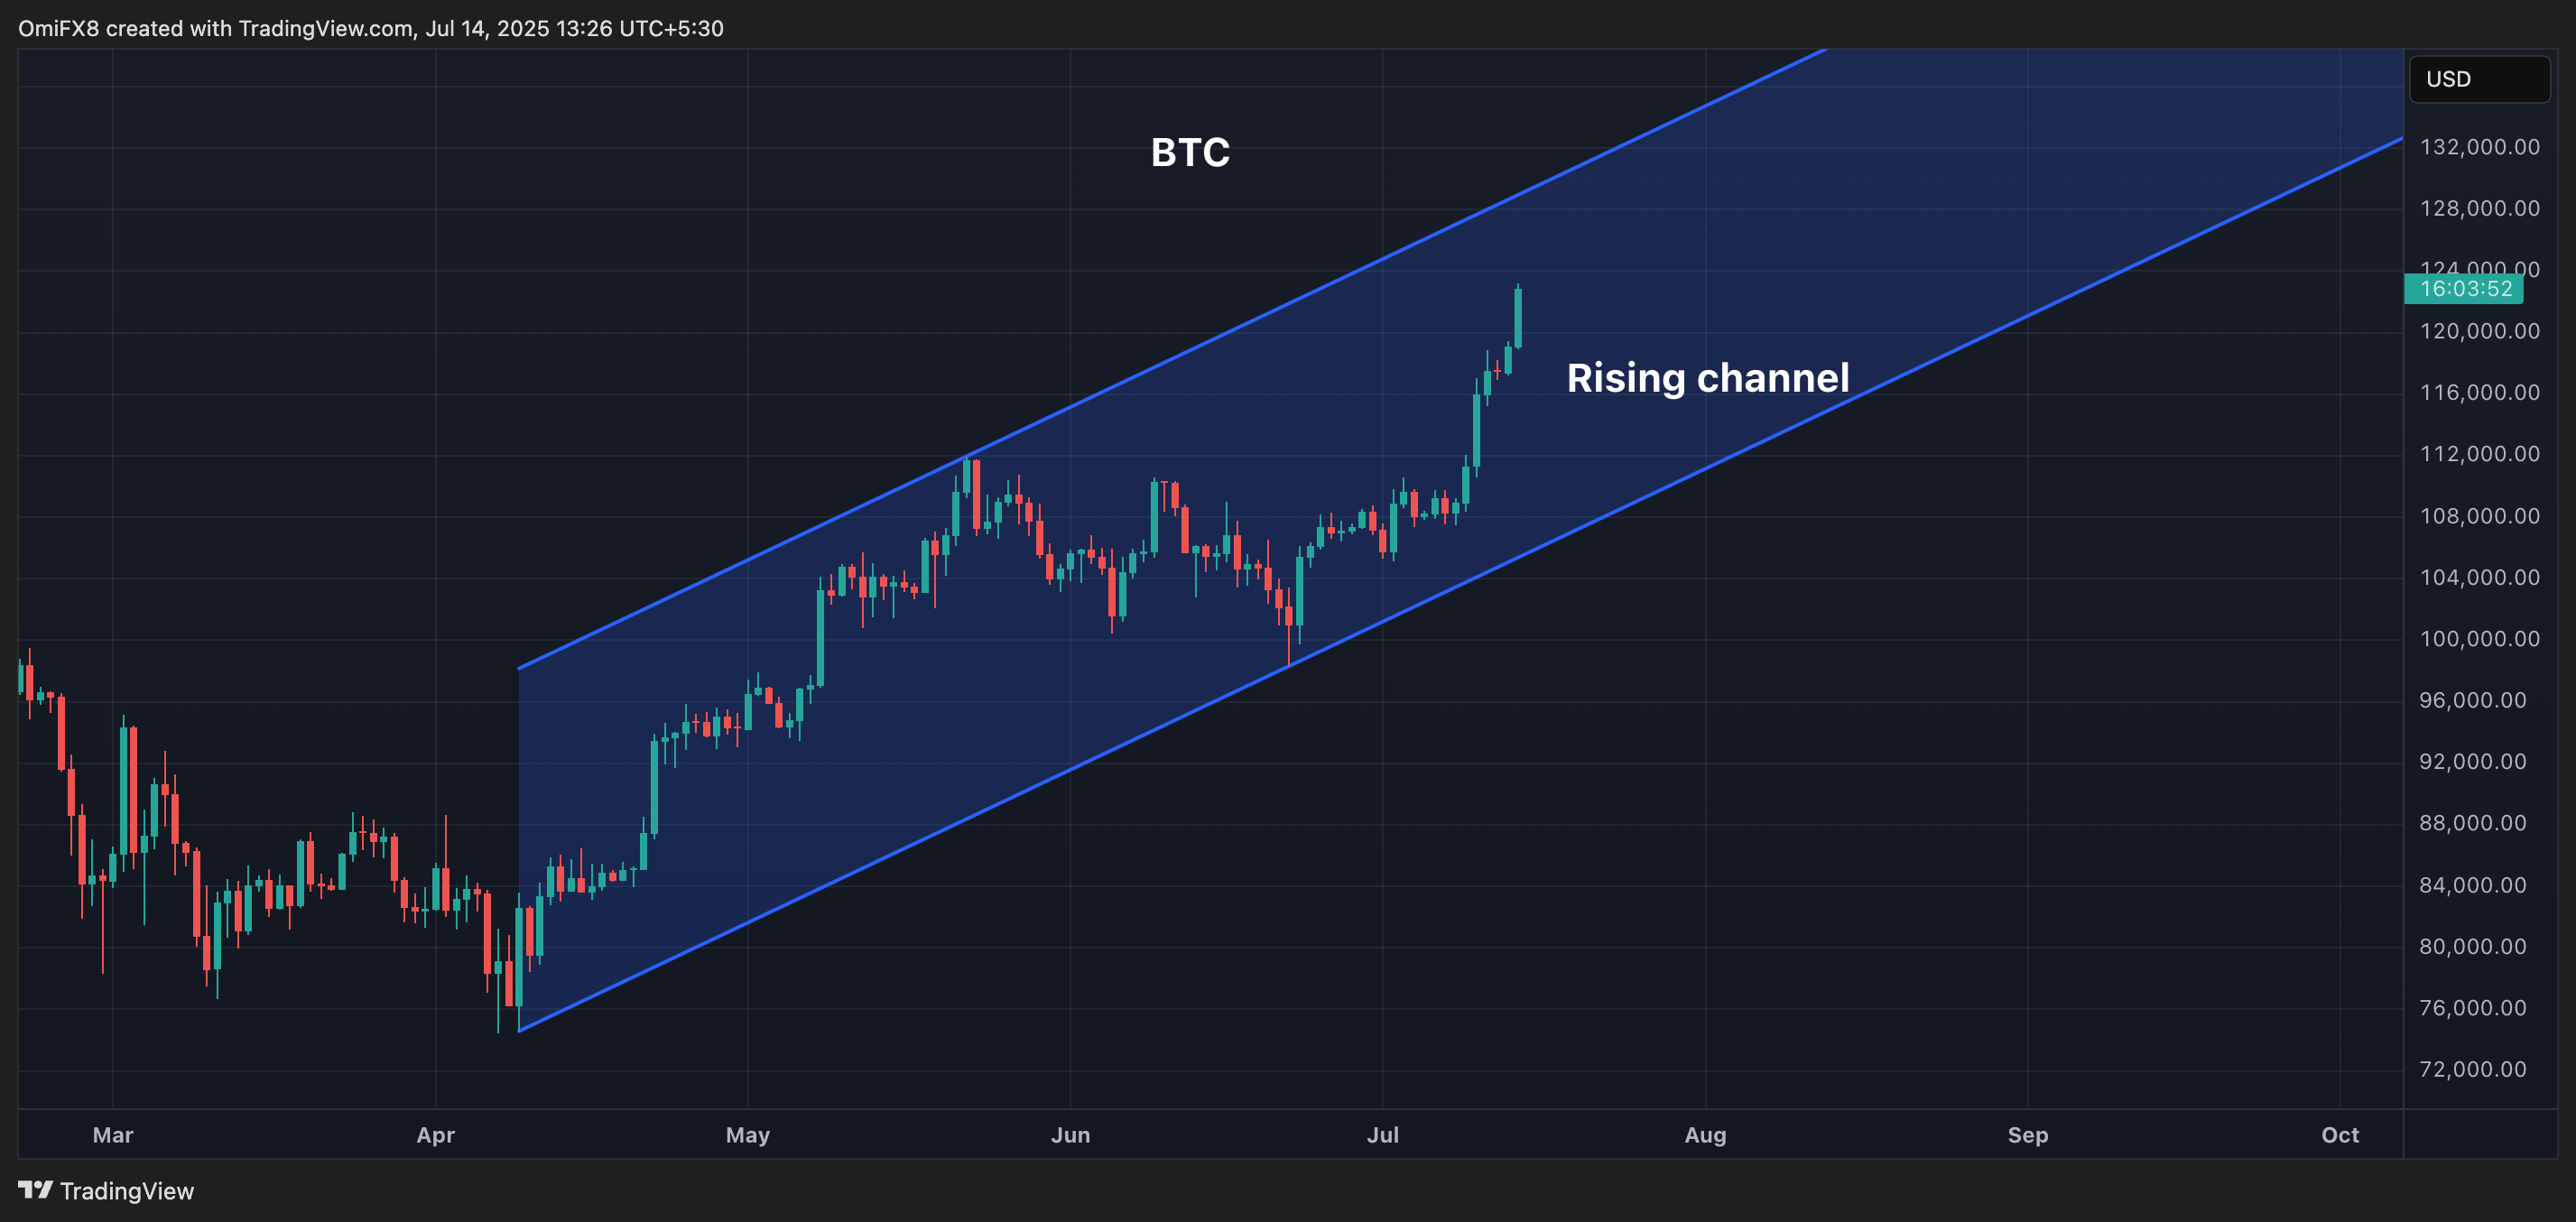
Overall, prices appear on track to test $130,000 the upper end of the ascending parallel channel drawn off April 9 and June 22 lows and the high on May 22.
That said, we could be in for consolidation between $120,000 and $130,000 for some time. Here is why:
Market makers are long gamma
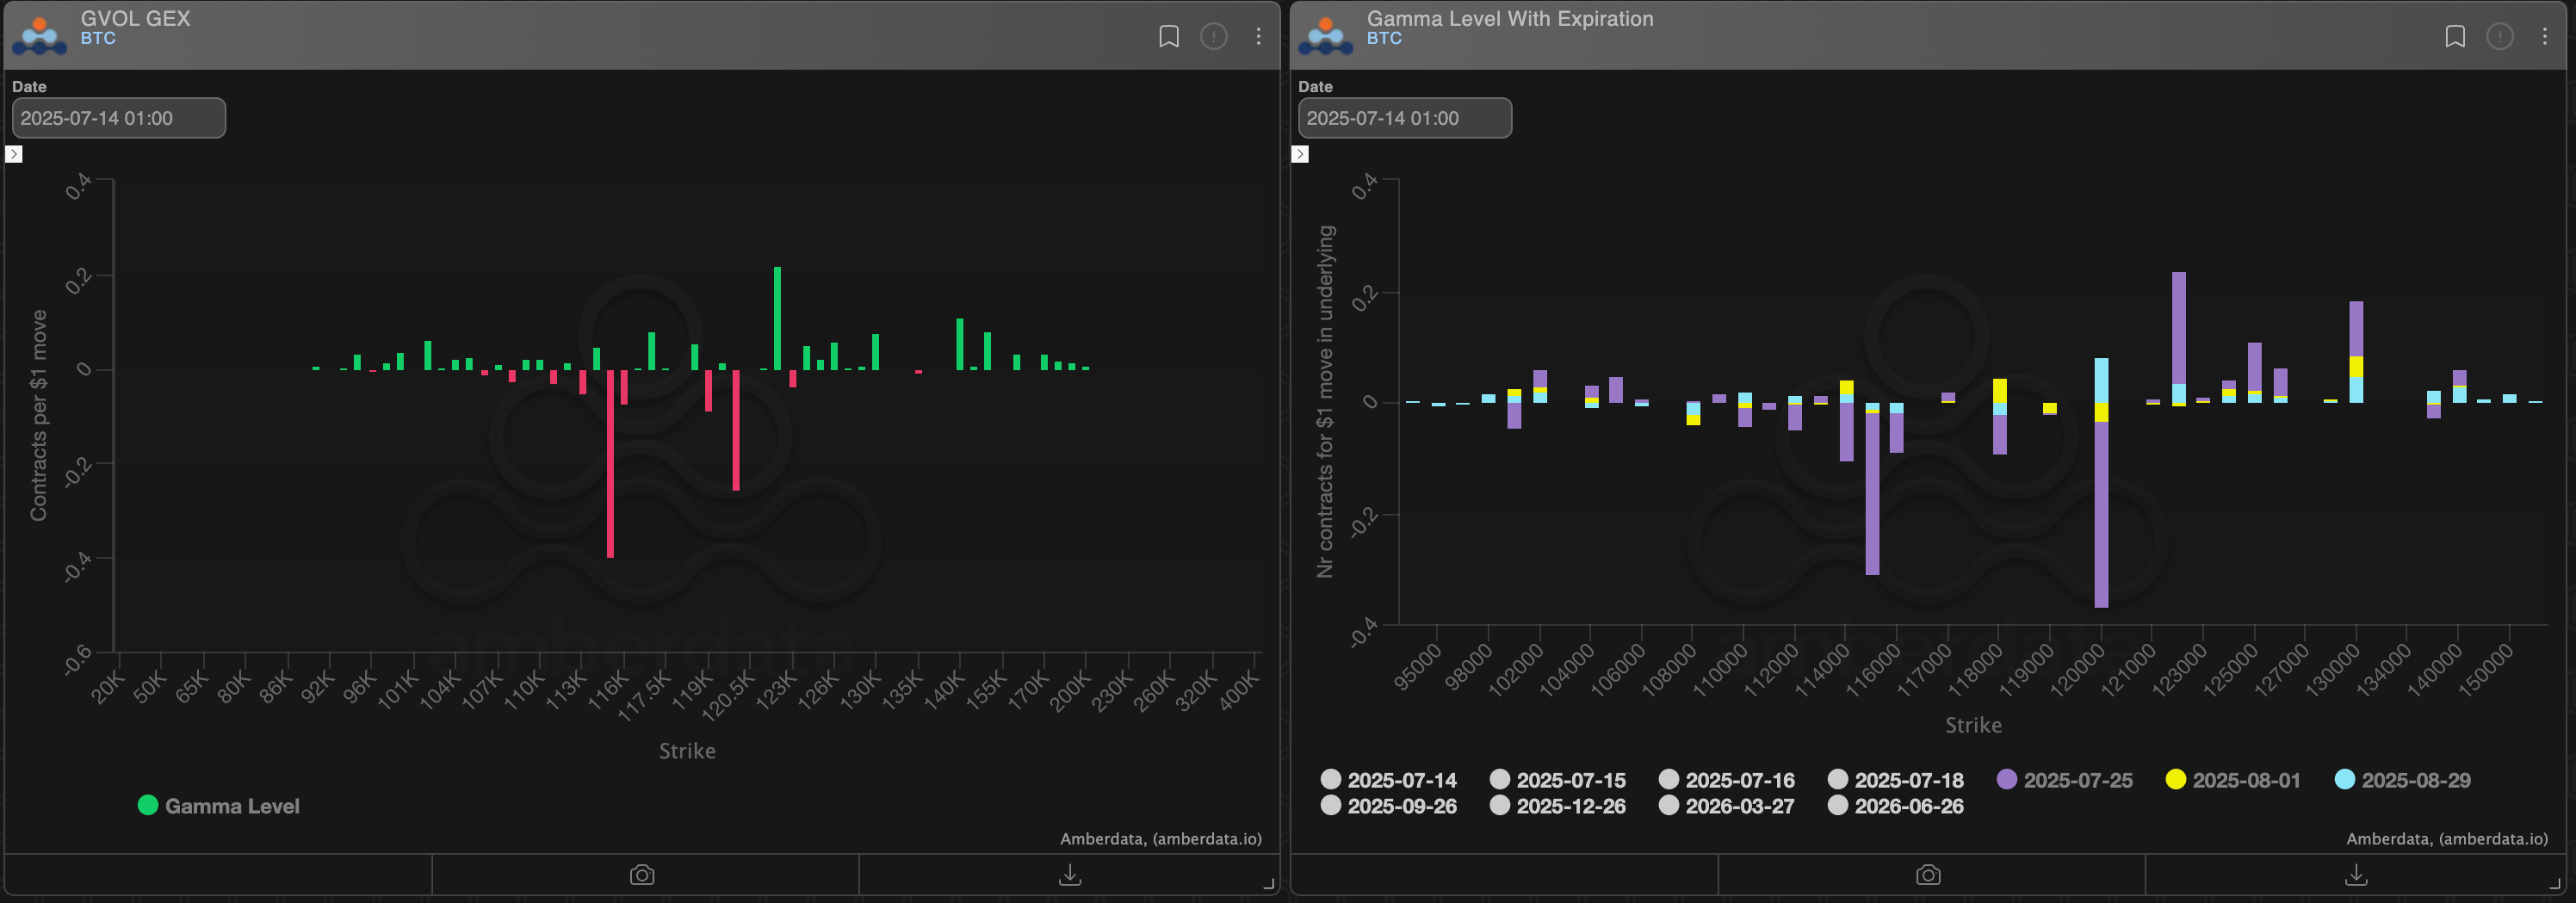
Options market makers are long gamma at strikes from $120,000 and $130,000 according to activity on Deribit tracked by Amberdata. Most of that is concentrated in the July 25, Aug. 1 and Aug. 29 expiries.
It means that market makers will likely buy low and sell high within that range to balance their net exposure to neutral, arresting the price volatility. That could keep prices rangebound, assuming other things are equal. A similar dynamic likely played out early this month, maintaining prices tethered to the $108,000-$110,000 range for some time.
DVOL upswing
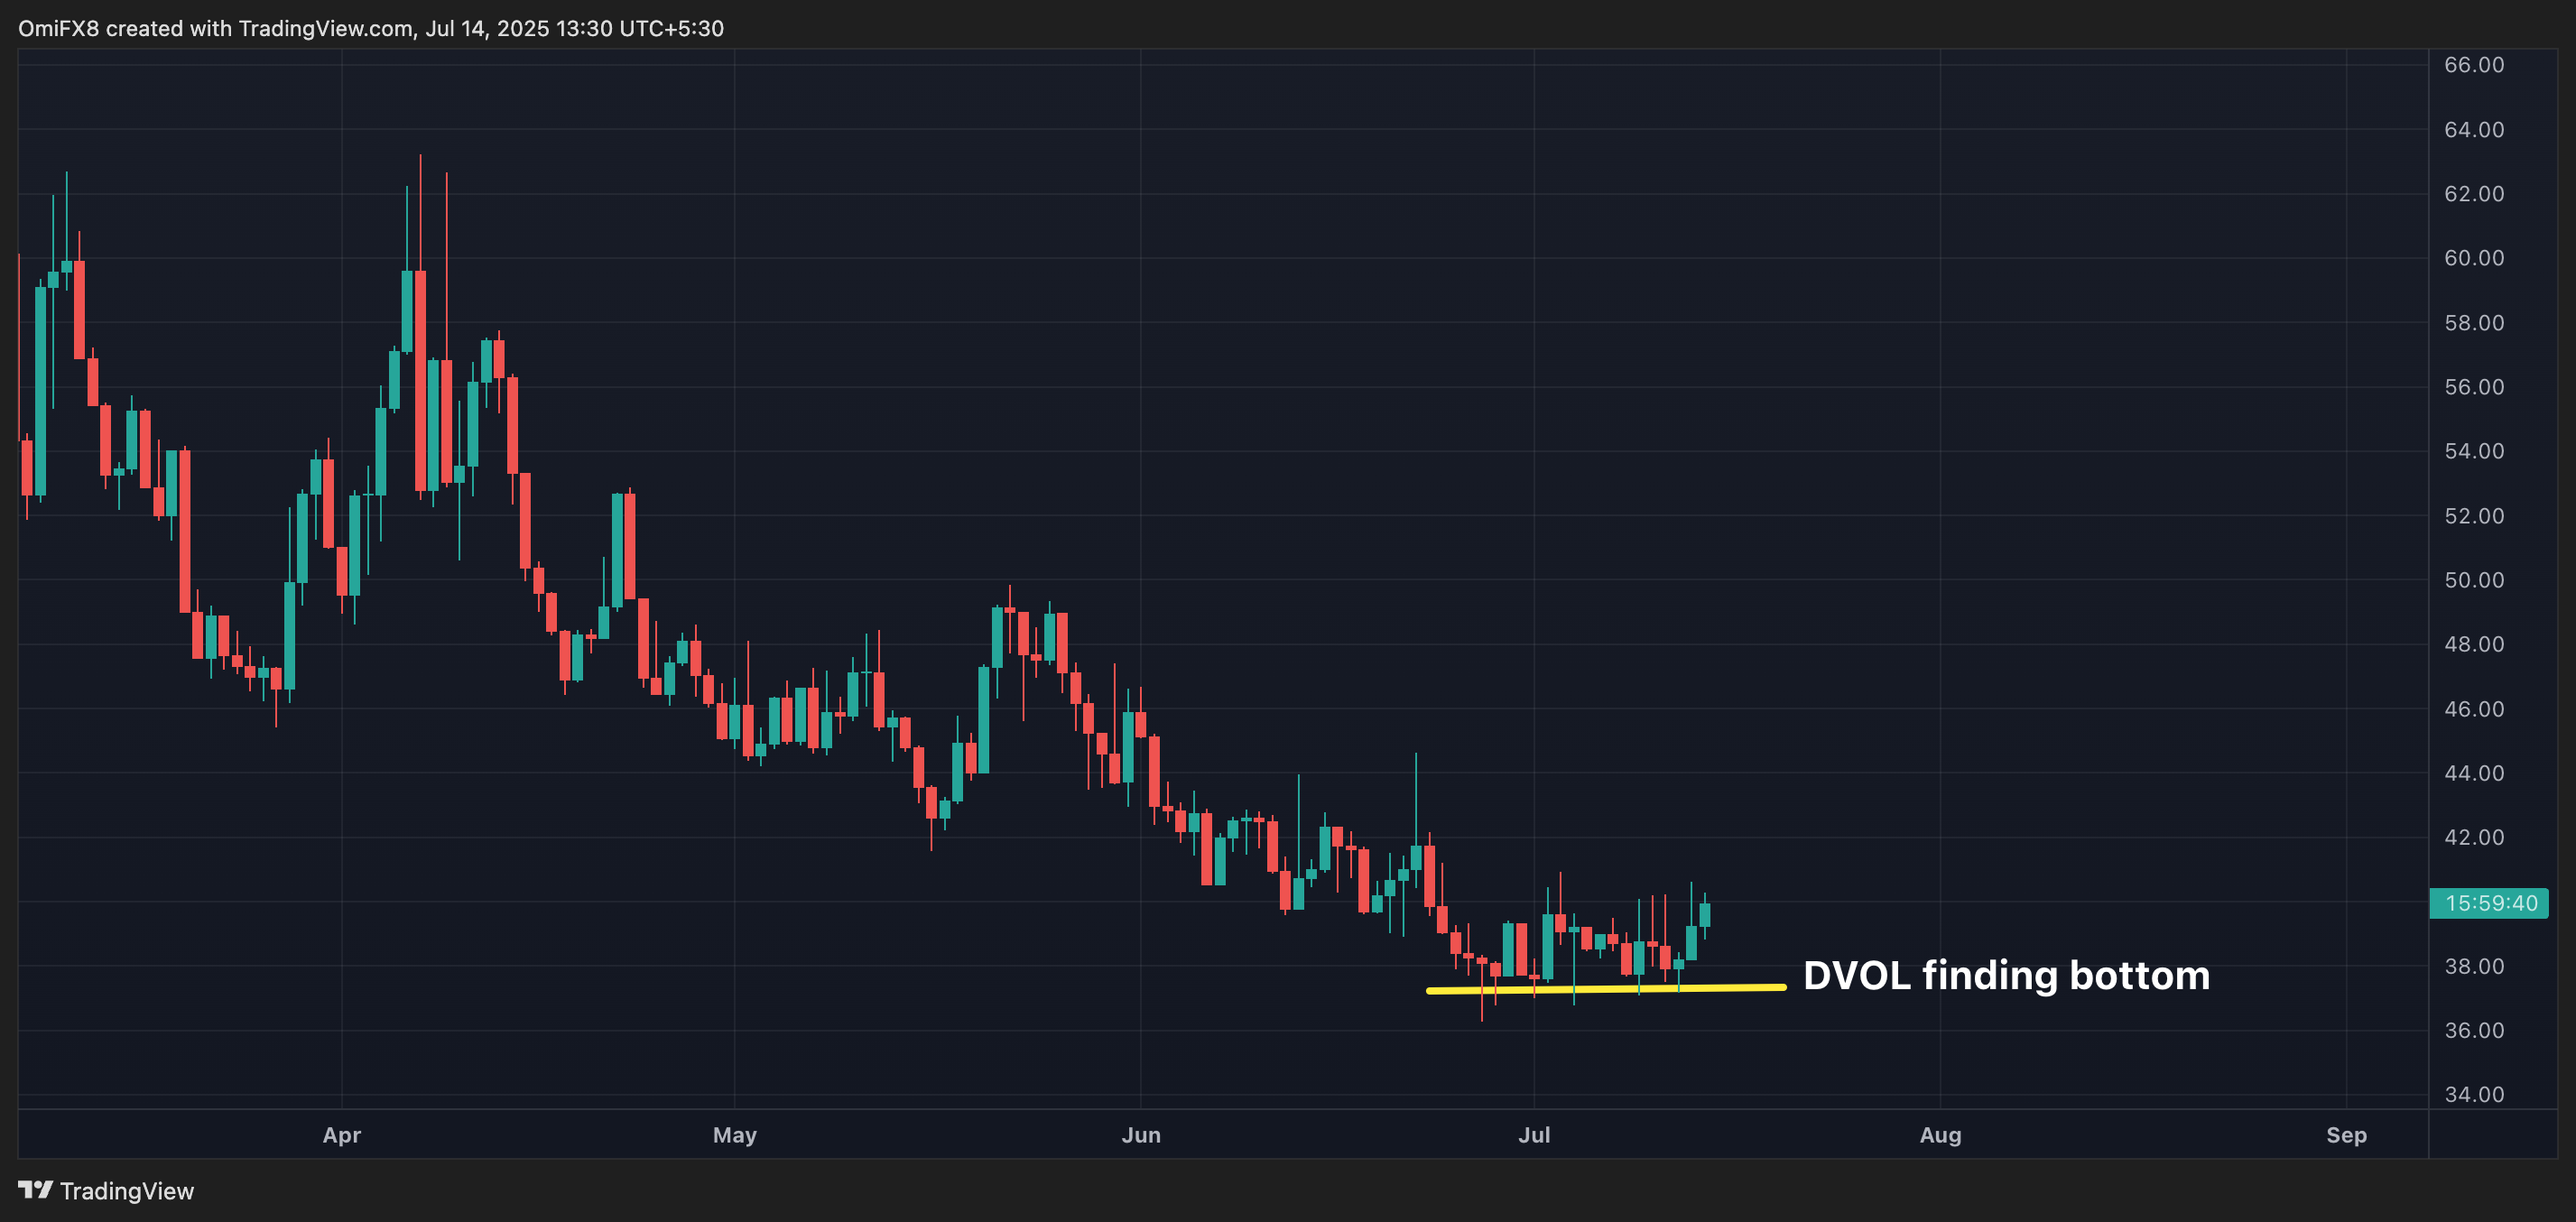
Bitcoin’s bull run from $70,000 to $122,000 is characterized by a breakdown in the historical positive correlation between the spot price and Deribit’s DVOL, which measures the 30-day implied or expected price turbulence. In other words, the DVOL has been trending lower throughout the price rally in a classic Wall Street-like dynamics.
However, DVOL seems to have found a bottom at around annualized 36% since late June. Moreover, applying technical analysis indicators like the MACD to the DVOL suggests the index could soon turn higher, and it could mean a correction in BTC’s price, considering the two variables are now negatively correlated.
DXY ends downtrend
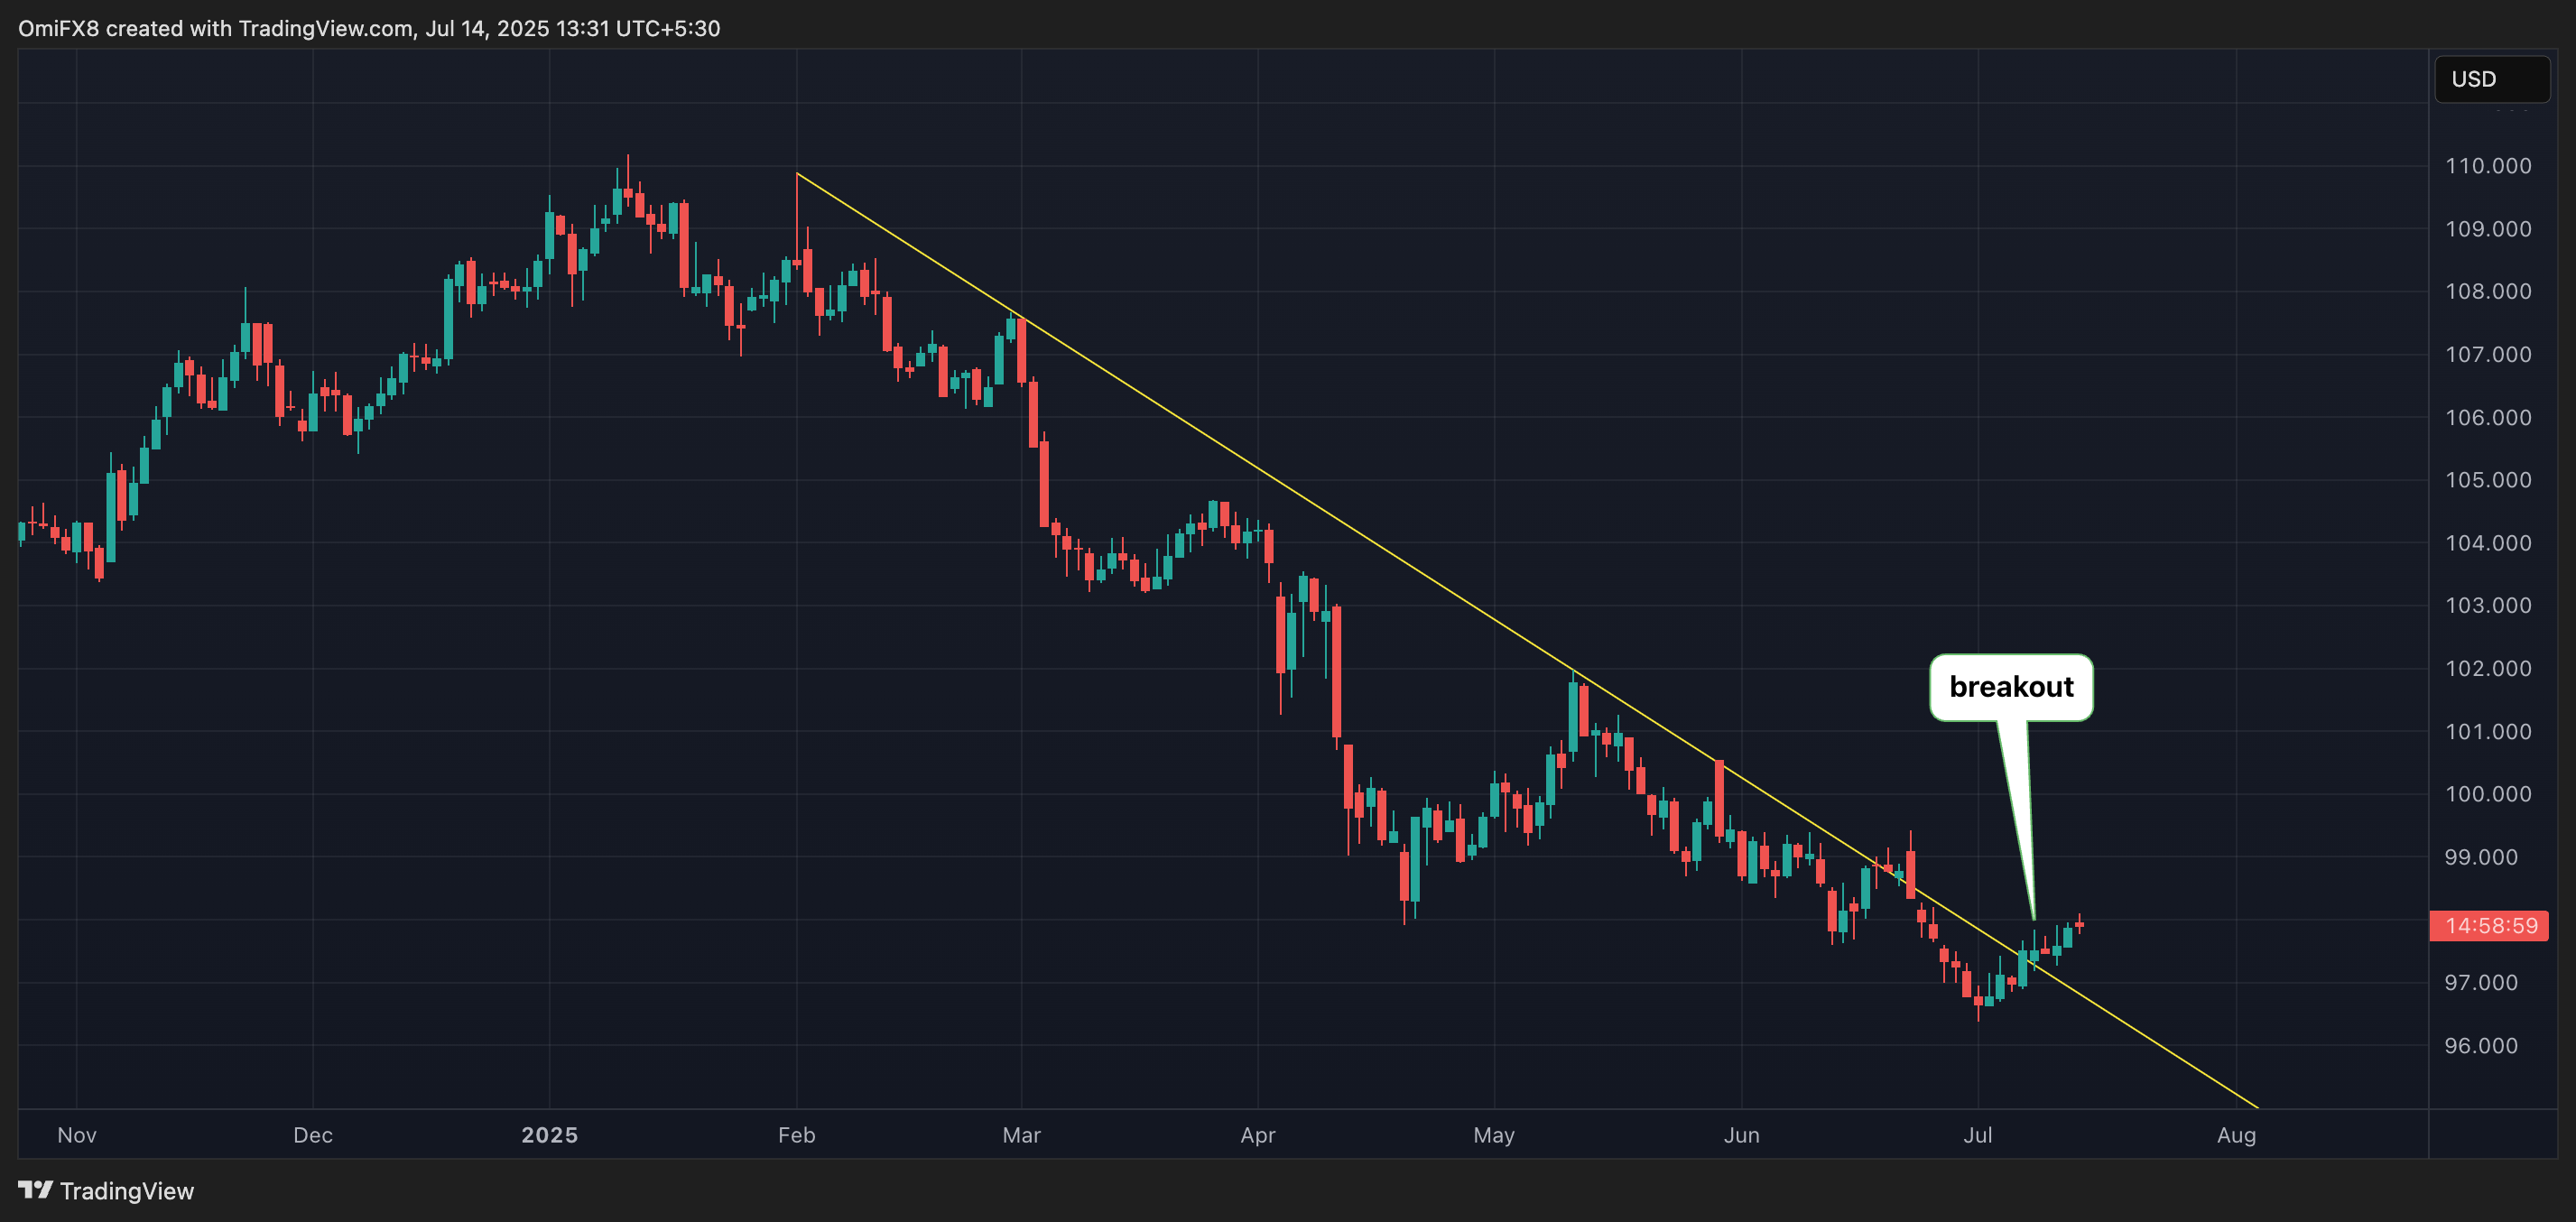
The dollar index, which tracks the greenback’s value against major currencies, has bounced nearly 17% to 97.00 this month. The recovery has penetrated the downtrend line, representing the sell-off from early February highs.
The breakout indicates the end of the downtrend. This comes as potential U.S. sanctions on countries buying Russian oil could lift energy prices, a positive outcome for the energy-independent U.S. and the USD, as ING said in a note to clients Monday.
Accelerated recovery in the DXY could cap upside in the dollar-denominated assets like BTC and gold.
- AI’s take: When options market makers are “long gamma,” it means their delta (directional exposure) increases as the price moves in their favor and decreases when it moves against them. This typically leads to a stabilizing effect on price: as BTC rises towards $130,000 market makers will sell some BTC to maintain their delta-neutral positions, and if it dips towards $120,000 they’ll buy. This can create a “pinning” effect, keeping BTC within that $120,000-$130,000 range, especially as the July and August expiries approach.
- Resistance: $130,000, $140,000, $146,000.
- Support: $118,800, $116,650, $112,000.
ETH: Still stuck in an expanding triangle
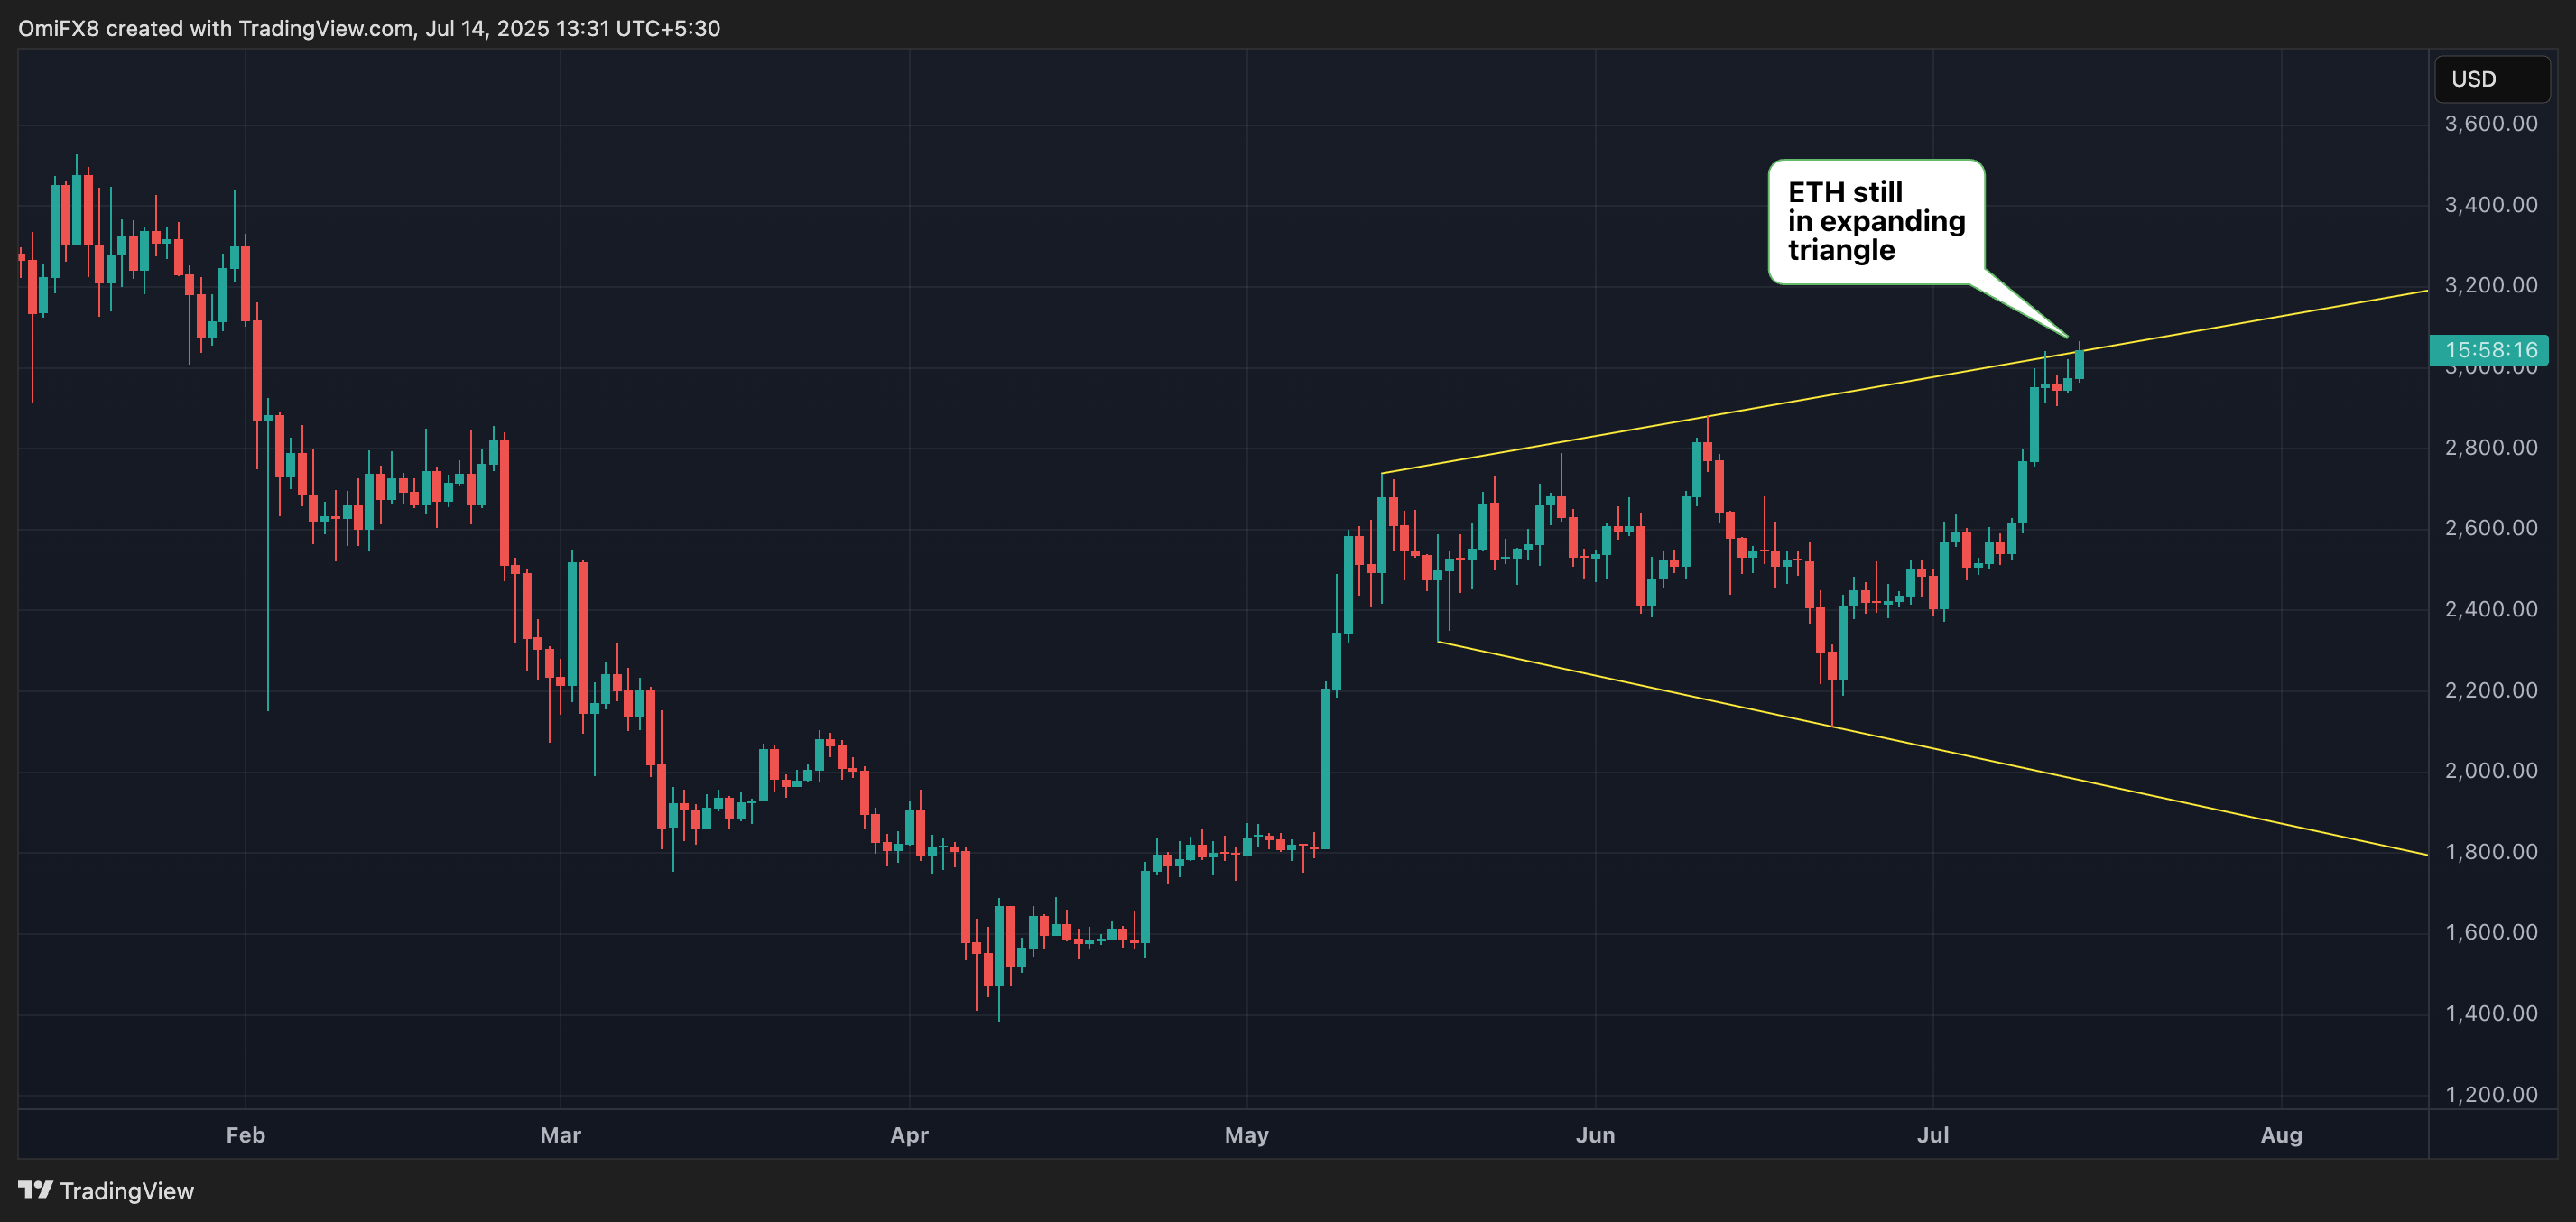
Despite the 22% month-to-date gain, ETH remains stuck in an expanding channel, identified by trendlines connecting May 13 and June 11 highs and lows hit on May 18 and June 22.
As of writing, prices pushed against the upper trendline, but the probability of a convincing breakout looked bleak due to the daily chart stochastic flashing overbought conditions. In such situations, a pullback usually sets the stage for a breakout, which would shift focus to $3,400, a level targeted by options traders.
- AI’s take: The daily stochastic being overbought indicates that momentum is stretched, making a convincing push above the upper trendline unlikely in the short term.
- Resistance: $3,067 (the 61.8% Fib retracement), $3,500, $3,570, $4,000.
- Support: $2,905, $2,880, $2,739, $2,600
SOL: Dual breakout reinforced
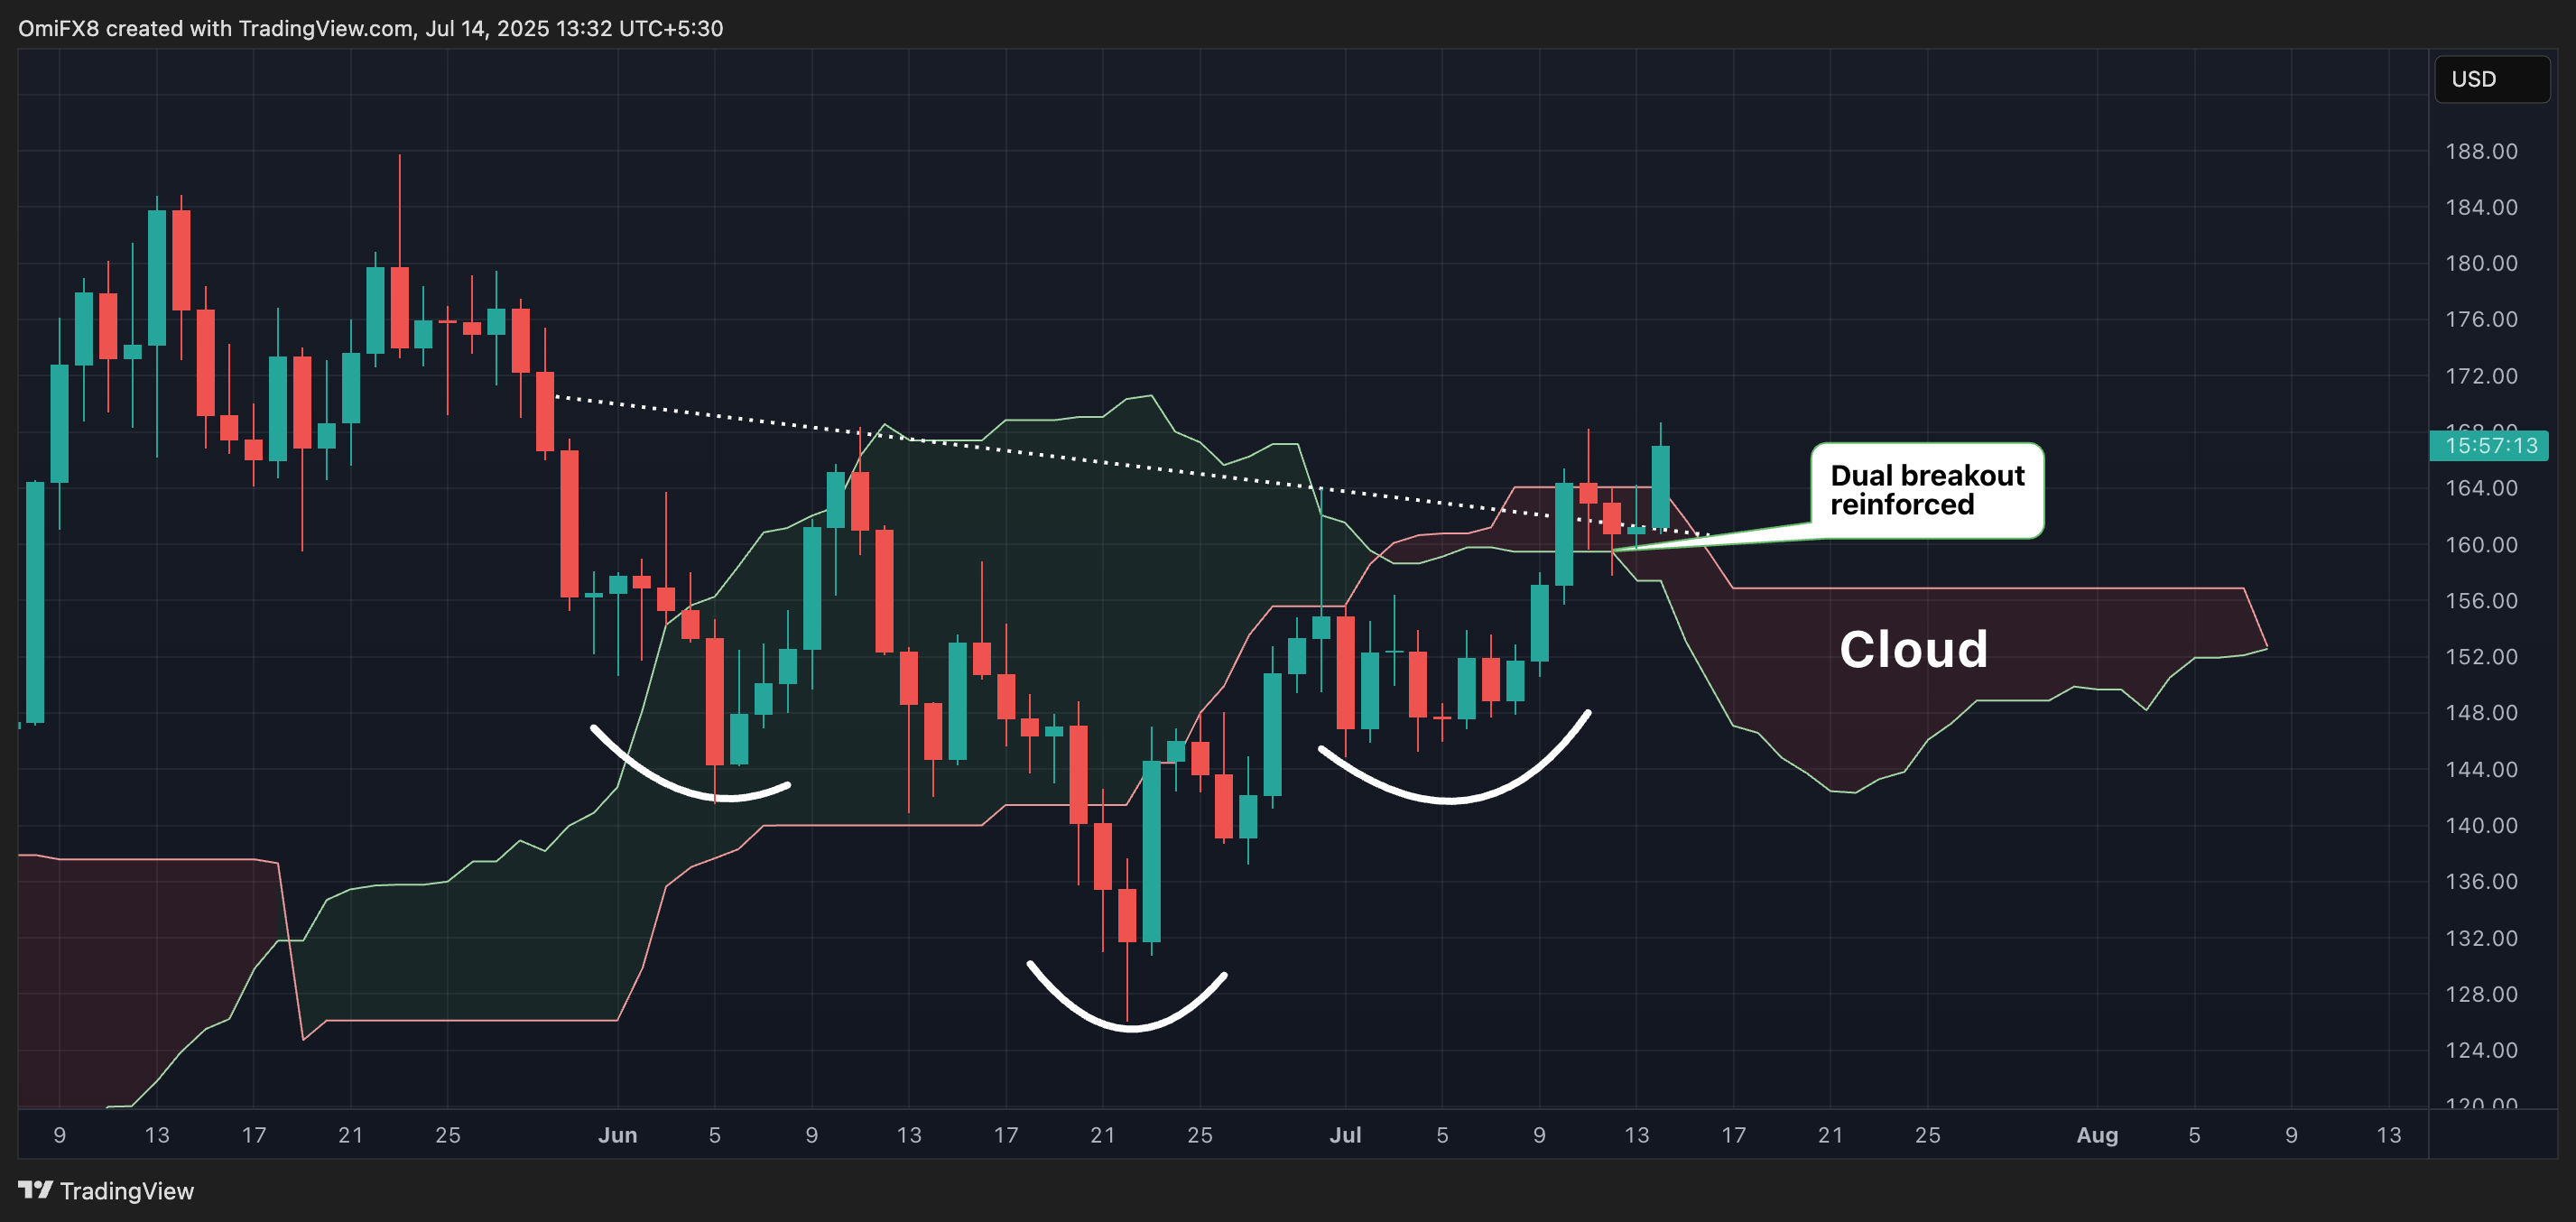
On Friday, we discussed the dual bullish breakout in Solans’ SOL (SOL), marked by an inverse head-and-shoulders breakout and prices moving above the Ichimoku cloud. That has been reinforced by Monday’s bounce, marking a quick recovery from the weekend’s minor price dip. A move through Friday’s high of $168 would add to bullishness, strengthening the case for a rally to $200.
- AI’s take: The quick recovery from the weekend dip, reinforcing the breakouts, is crucial. It indicates that the previous bullish signals were not “fakeouts” and that there’s underlying buying interest willing to step in on minor pullbacks.
- Resistance: $180, $190, $200.
- Support: $150 (the 100-day SMA), $145, $125.
XRP: MACD flips bullish
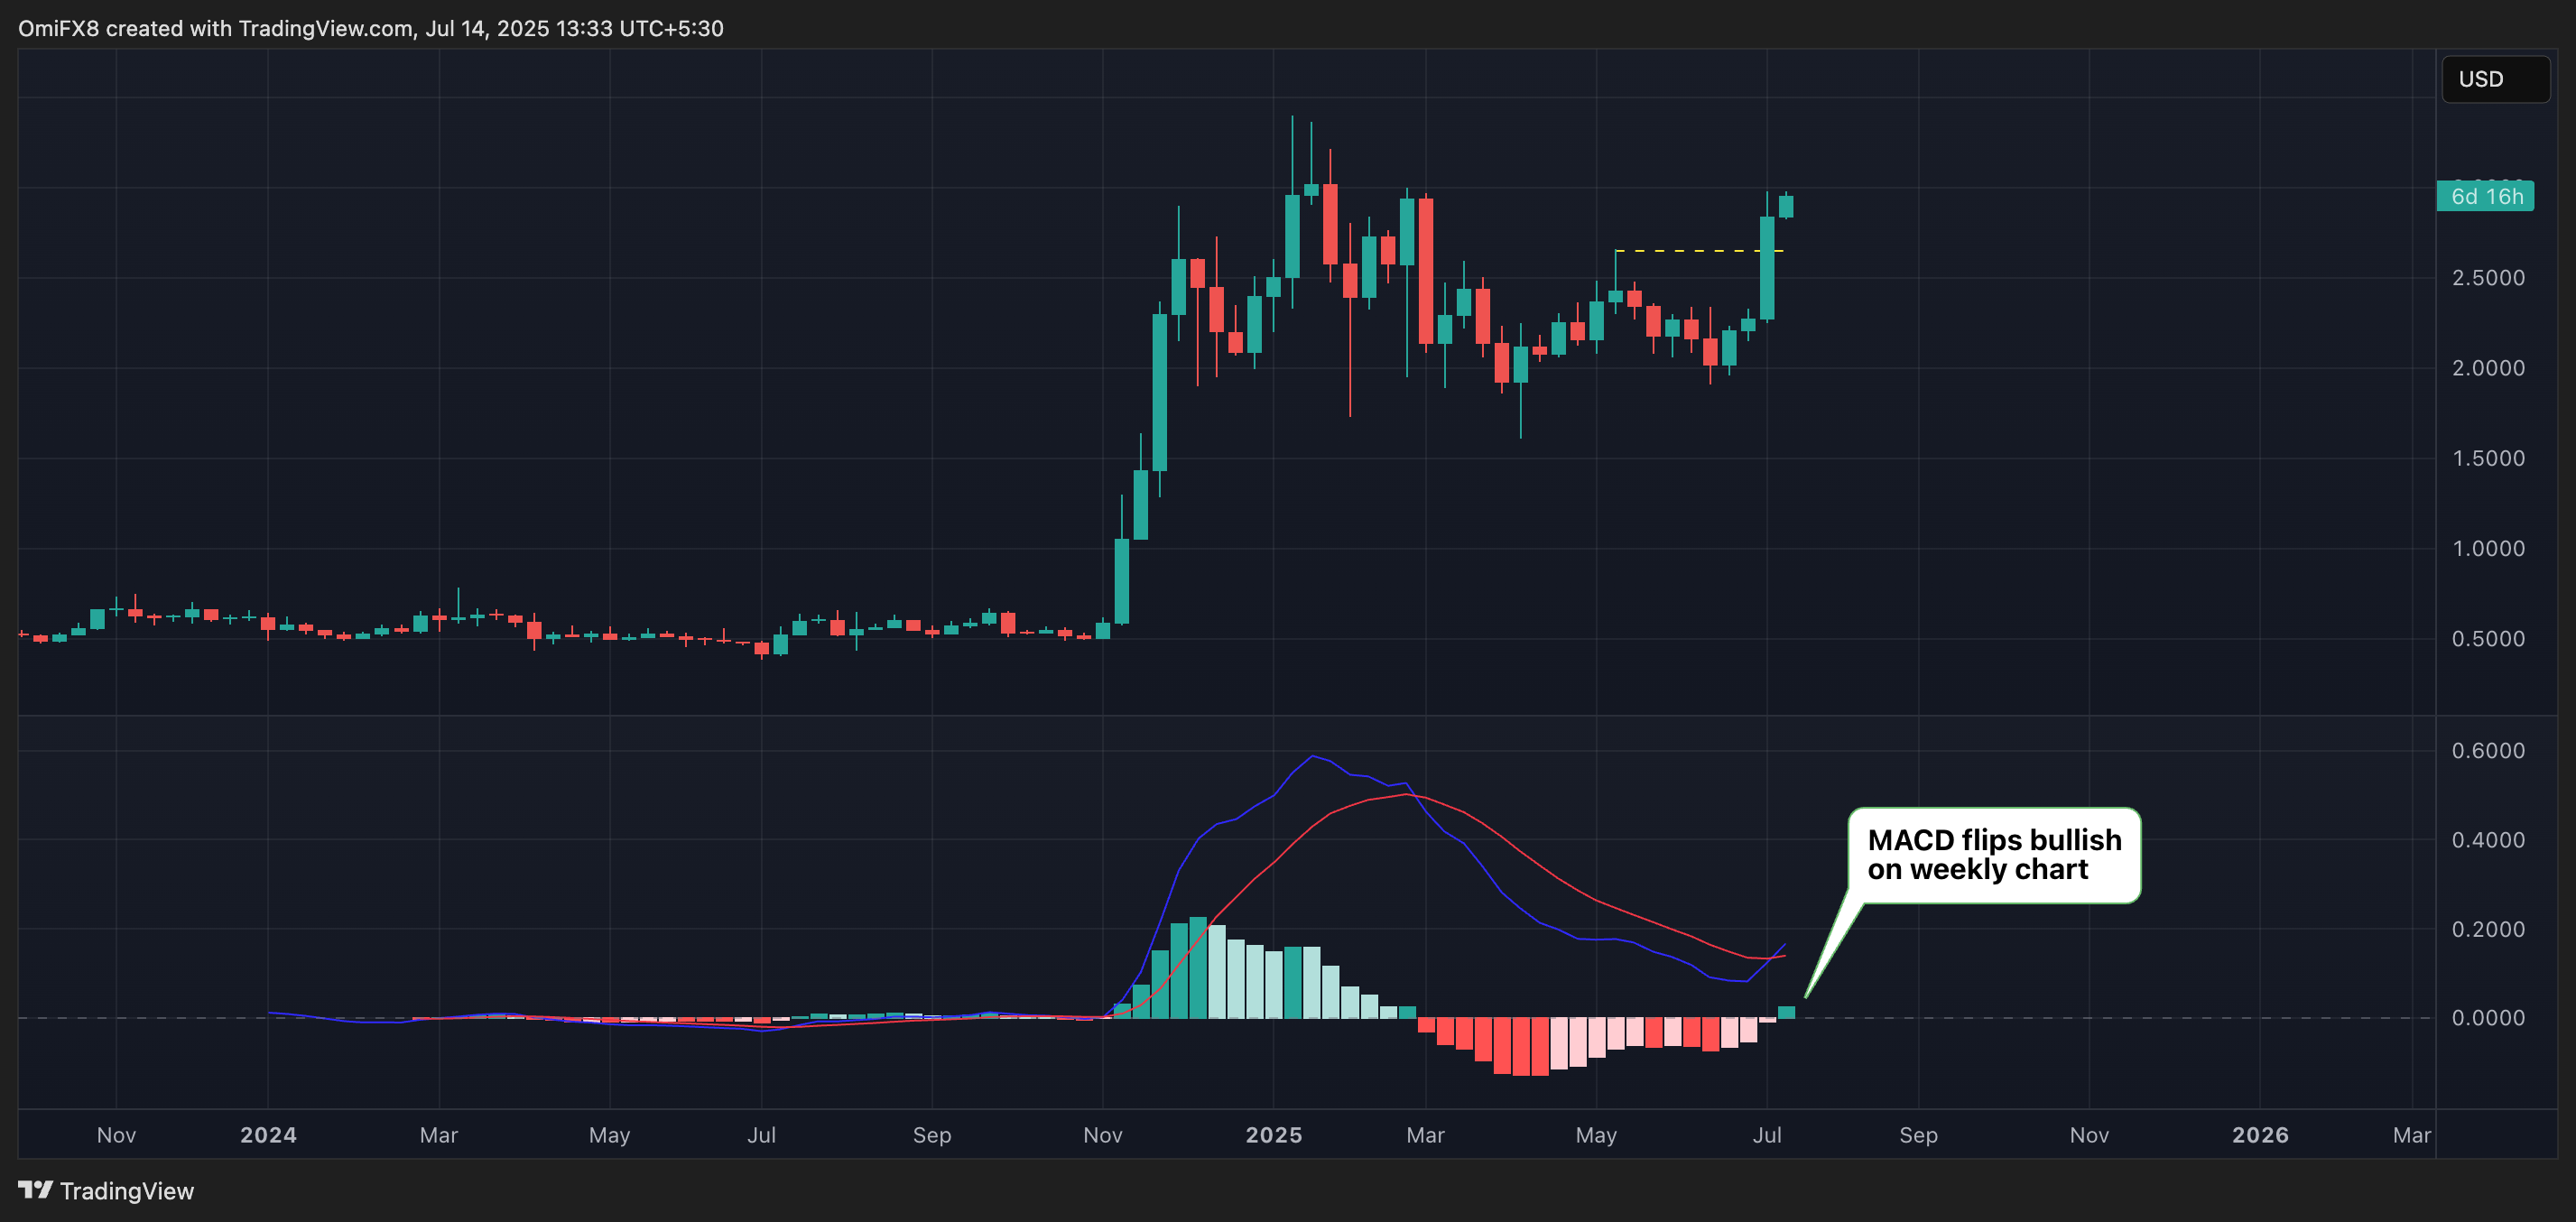
XRP’s (XRP) weekly chart MACD histogram has crossed above zero, indicating a bullish shift in sentiment. The pattern is reminiscent of the bullish MACD trigger in BTC that set the stage for a record rally from $70,000 last year.
That, coupled with the 14-day RSI signaling the strongest bull momentum since December, points to an impending breakout above $3 and a rally to new lifetime highs in the near term. Watch out for bearish RSI divergences on intraday charts as those could mark temporary price pullbacks.
- AI’s take: “Reminiscent of BTC’s bullish MACD trigger”: This comparison is powerful. If XRP is following a similar pattern to BTC’s previous record rally, it suggests the potential for a significant and sustained uptrend.
- Resistance: $3.00, $3.40
- Support: $2.20, $1.90, $1.60.

