This is a daily technical analysis by CoinDesk analyst and Chartered Market Technician Omkar Godbole.
Shares in cryptocurrency exchange Coinbase recently rose to $380, reclaiming valuations last seen on its Nasdaq debut on April 15, 2021, according to data source TradingView.
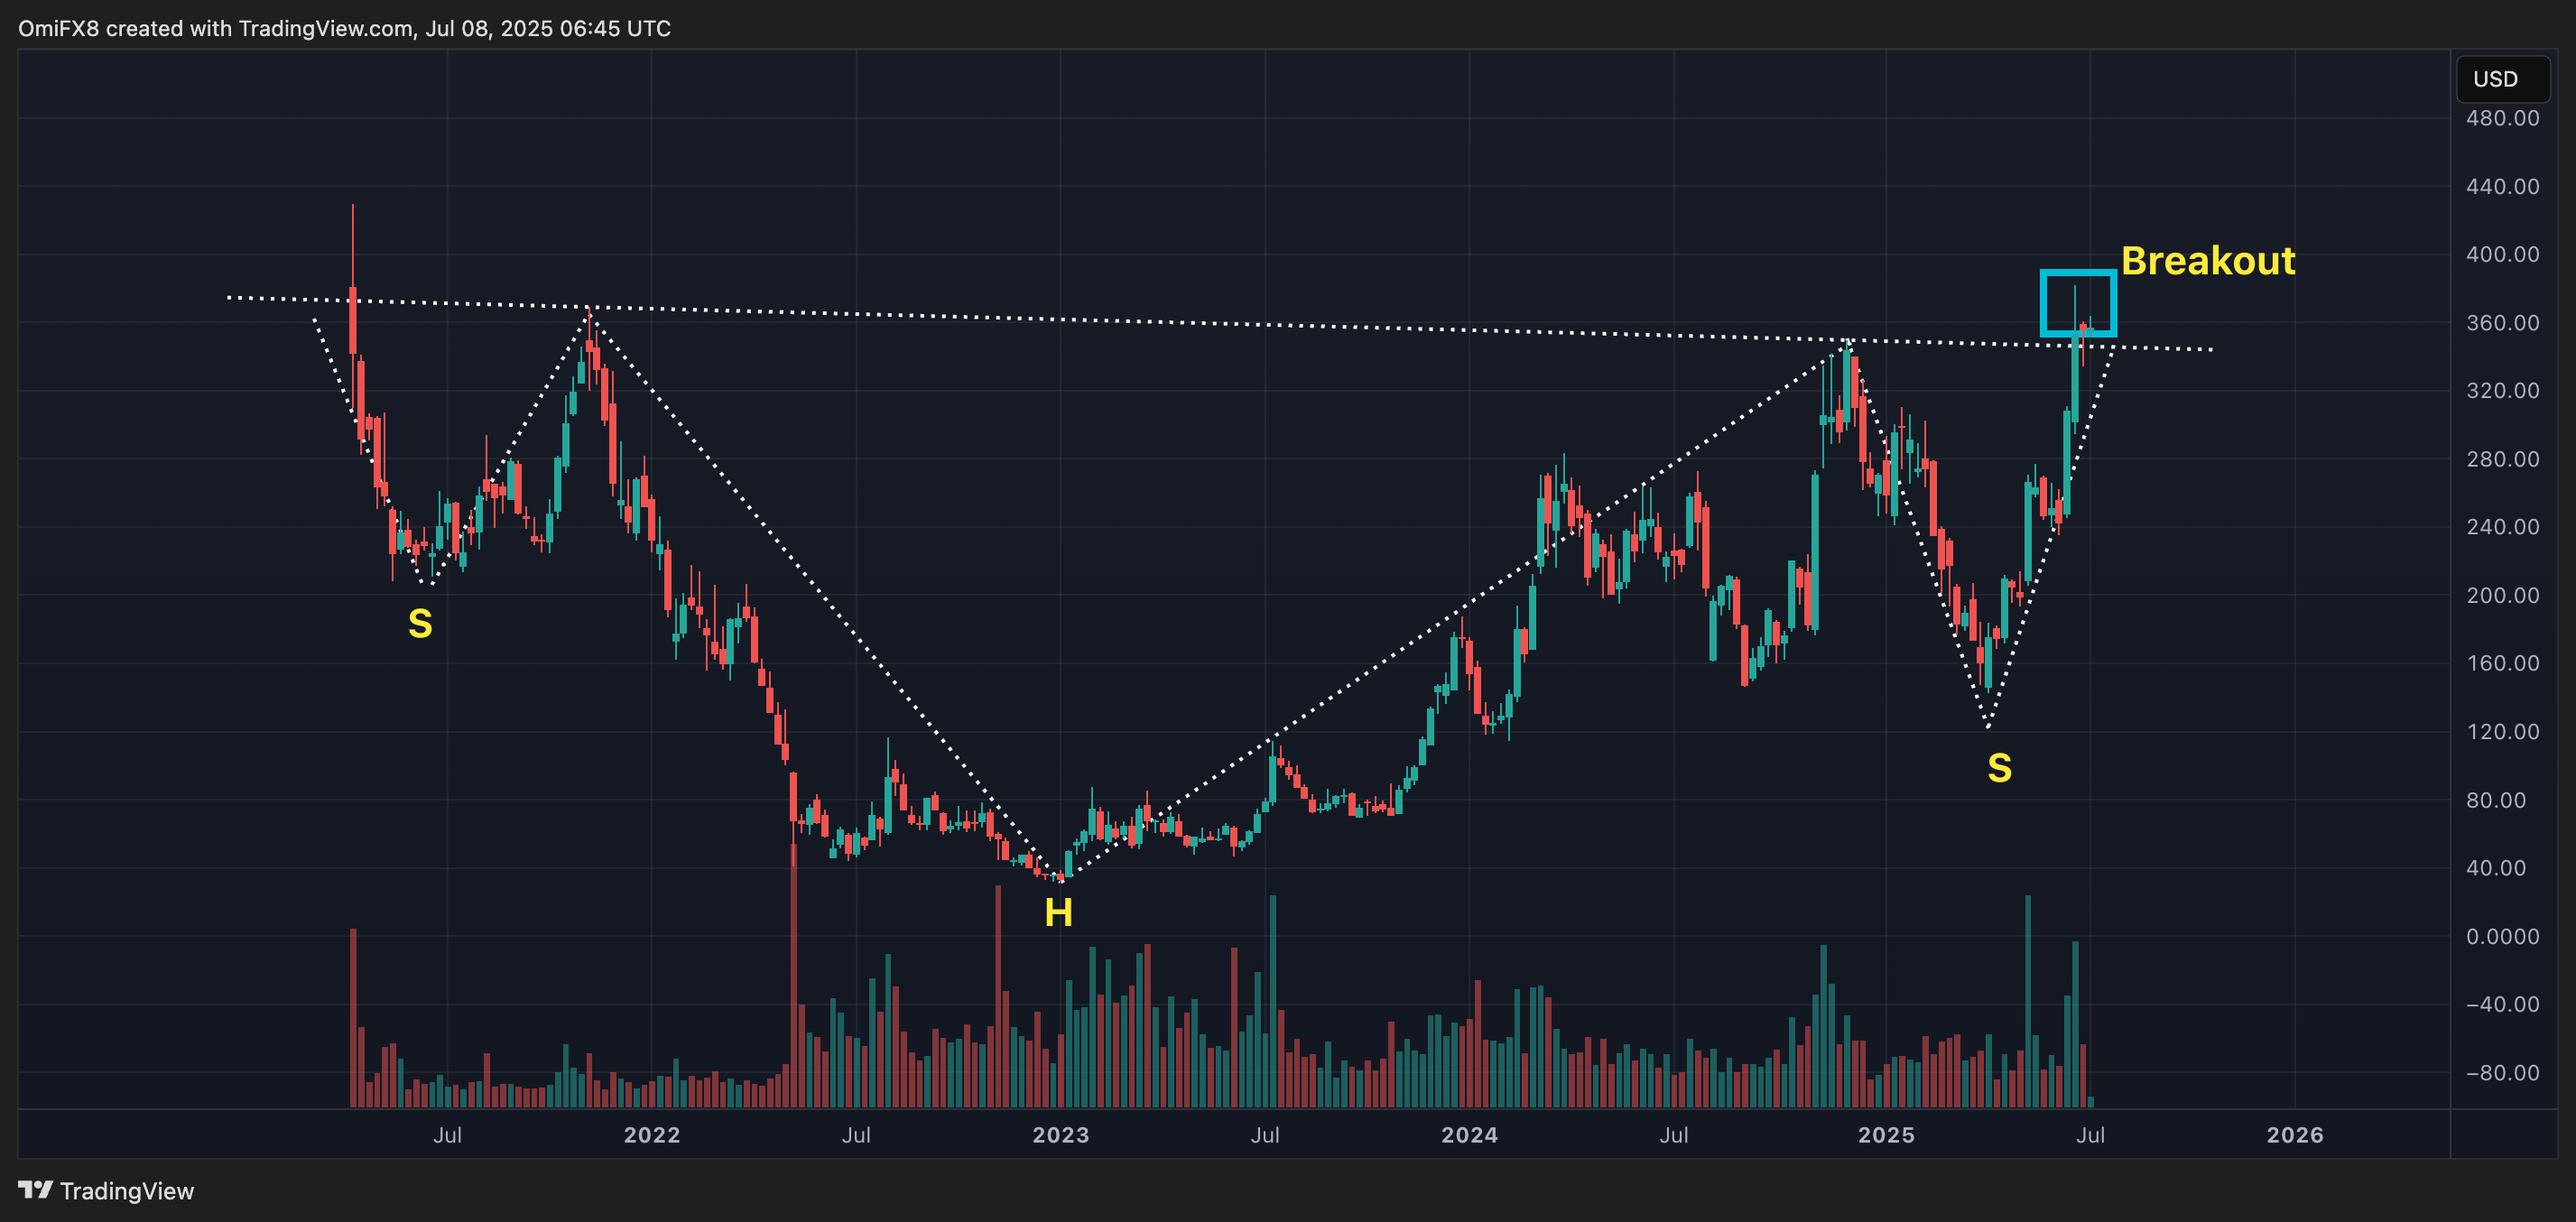
The round trip, encompassing a recovery from the 2022 low of $31.55, has triggered an inverse head-and-shoulders (H&S) breakout on the weekly chart, indicating a prolonged uptrend potentially to levels above $600.
Understand inverse H&S
An inverse head-and-shoulders pattern comprises three troughs, with the middle one being the deepest, marking peak bearishness, and the other two relatively shallower and roughly equidistant in magnitude.
The shallower right shoulder, a sign of buyers looking to reassert themselves, is where volumes tend to pick up. Still, the bullish trend change is confirmed only after prices move above the neckline, a line connecting recoveries between the troughs. Trading volume typically drop as the pattern unfolds and rise as it nears completion.
Chart analysts typically add the gap between the neckline and the low point of the pattern to the breakout point to calculate the possible upside in what’s known as the “measured move” method of gauging potential rallies.
COIN’s breakout

COIN recently topped the neckline resistance and has established a base above the same since then. The measured move method suggest a potential rally to $660.
Note how trading volumes remain depressed as the deepest tough, the head, was being formed through 2022-23 and picked up in April as the right shoulder neared completion.
The bullish technical development is consistent with the constructive outlook shared by most fundamental analysts. Recently, Oppenheimer raised its projection for COIN to $395 from $293, maintaining an “outperform” rating on the shares.

