This is a daily technical analysis by CoinDesk analyst and Chartered Market Technician Omkar Godbole.
Bitcoin cash BCH, the best performing top 100 cryptocurrency of the past 24 hours, looks set to chalk out a bull run against bitcoin BTC.
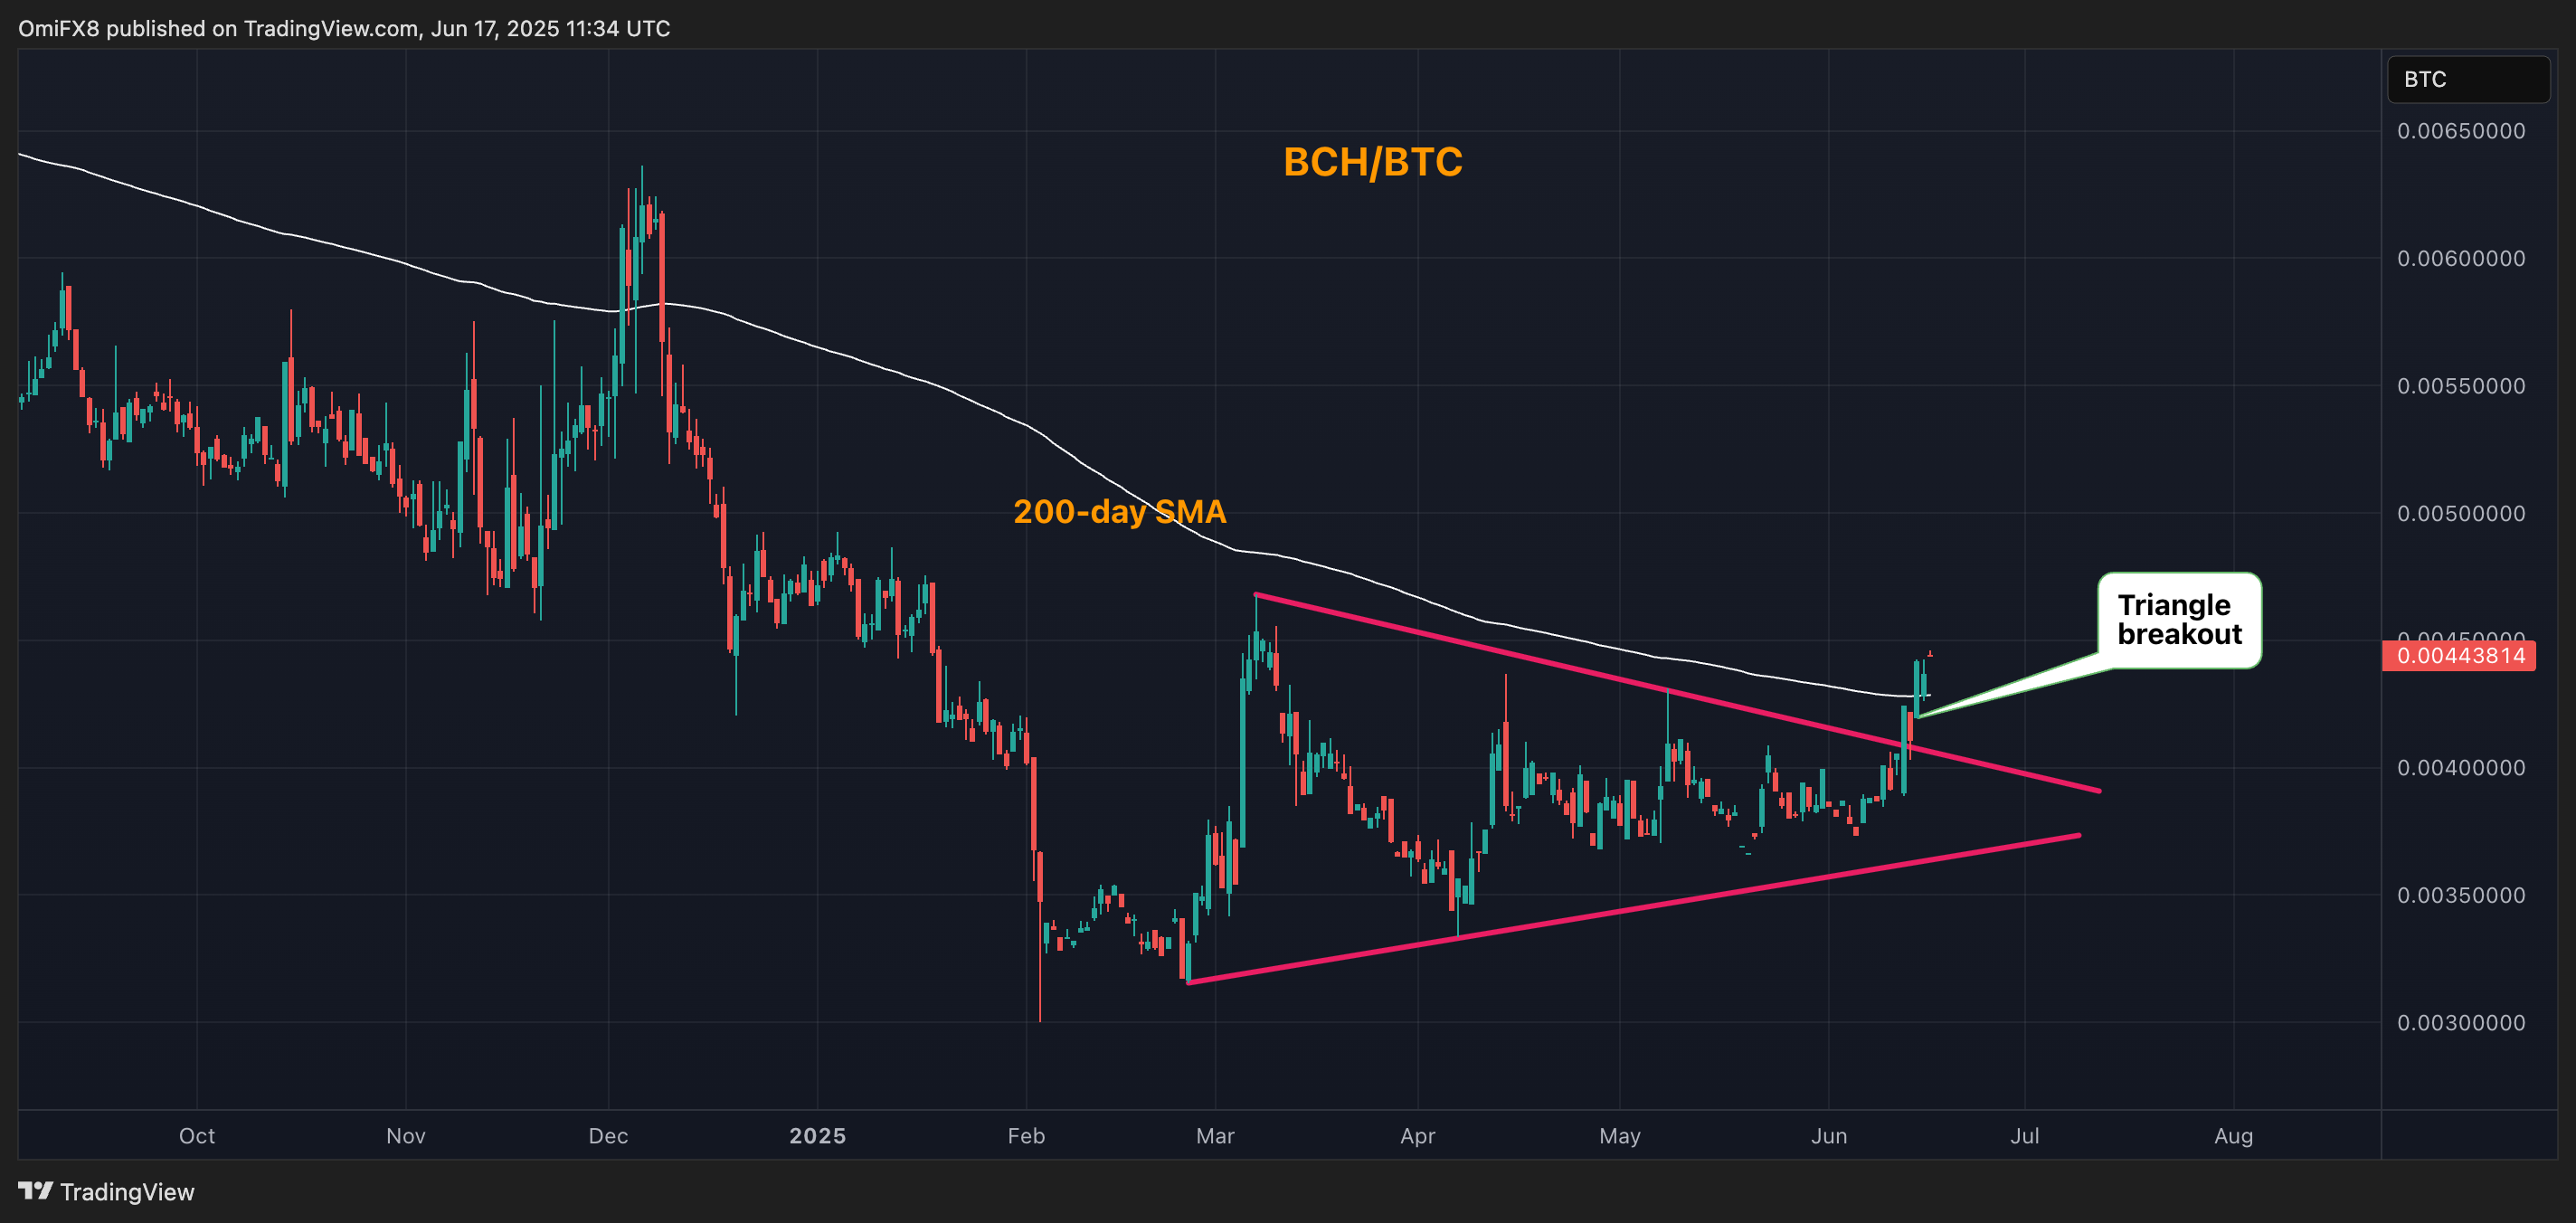
That’s because the BCH/BTC trading pair listed on Bitstamp has jumped out of a triangle pattern identified by series of descending intraday price highs and ascending price lows, both representing a narrowing price range.
Breakouts from these patterns typically lead to significant moves, which means BCH could chalk out an impressive bull run against bitcoin in the days ahead.

Adding to the bull case is the fact that the ratio has already topped the 200-day simple moving average, a barometer of long-term trends tracked by both retail and institutions.
The ratio’s expected ascent could face resistance at 0.00467, the swing low registered in February 2024, followed by the December high of 0.00636.
The bullish outlook stands invalidation in case of a potential move below the monthly low of 0.00373.
HYPE’s bearish divergence
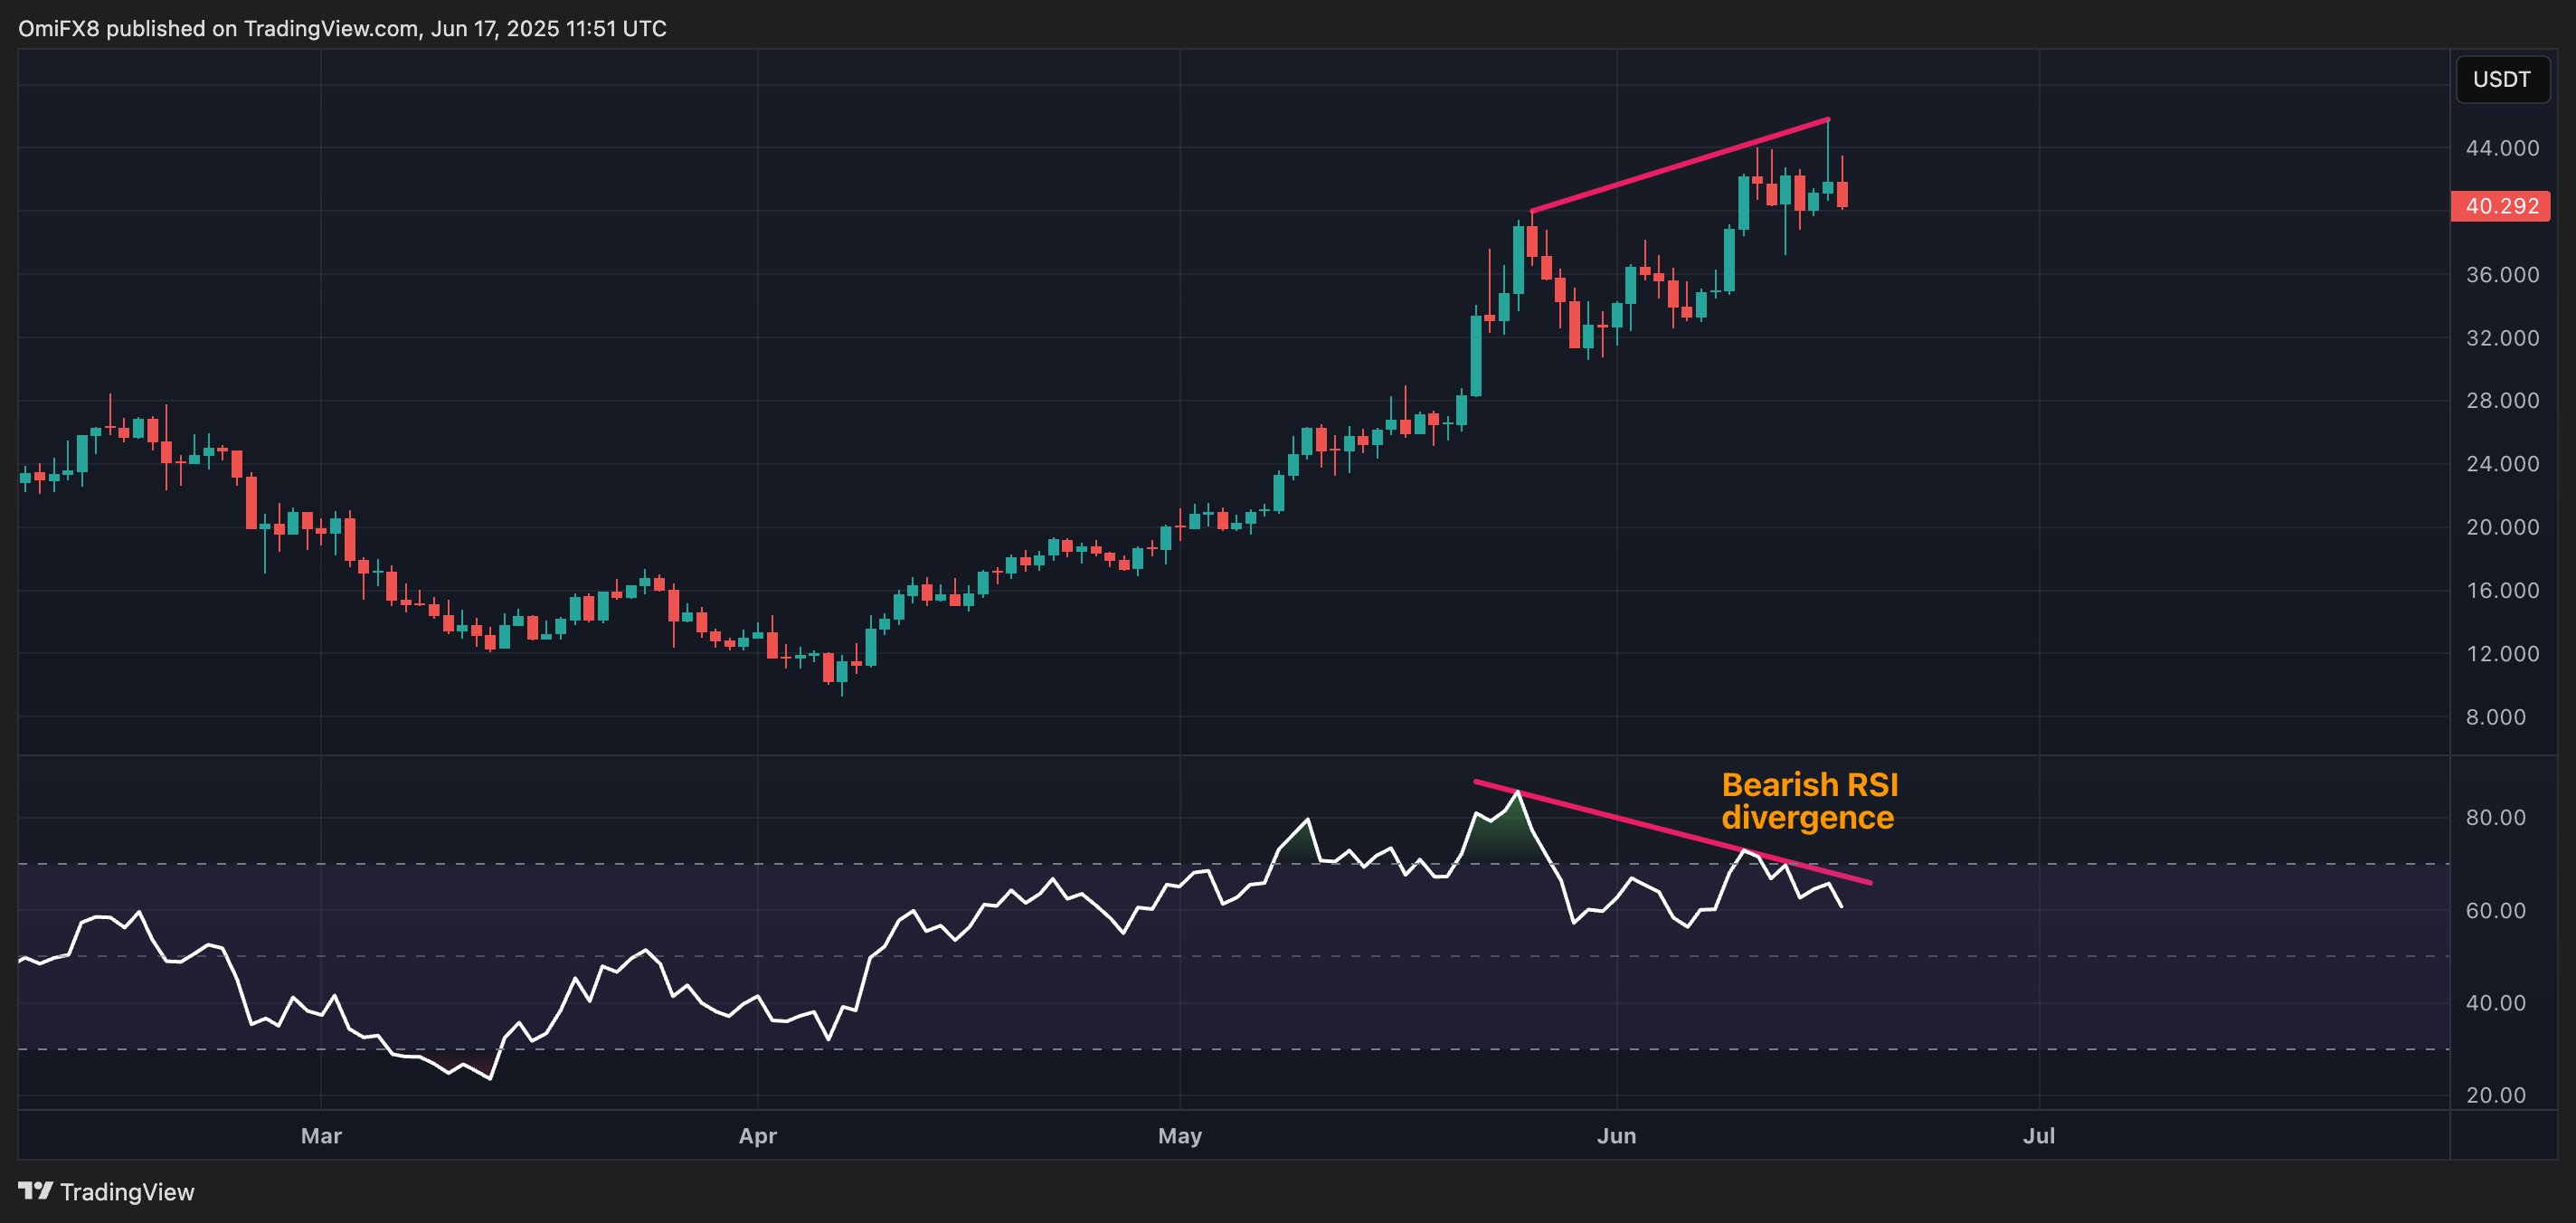
Decentralized exchange Hyperliquid’s HYPE token may have headed lower, having chalked out a near five-fold rally to $44 in three months.
HYPE’s daily price chart shows that while the token has recently hit higher intraday highs, the 14-day relative strength, a momentum osicalltor, has diverged lower, confirming a so-called negative divergence. The pattern is said to reflect weakening of upside momentum and often presages bearish trend reversals.


