
The number one question on investors’ minds is whether an asset has hit its bottom after being in a sustained downtrend for an extended period of time.
Recent price action suggests that bitcoin (BTC) may have found its bottom just above $76,000 on March 10. This move has formed a pattern reminiscent of previous bottoming events in recent history.
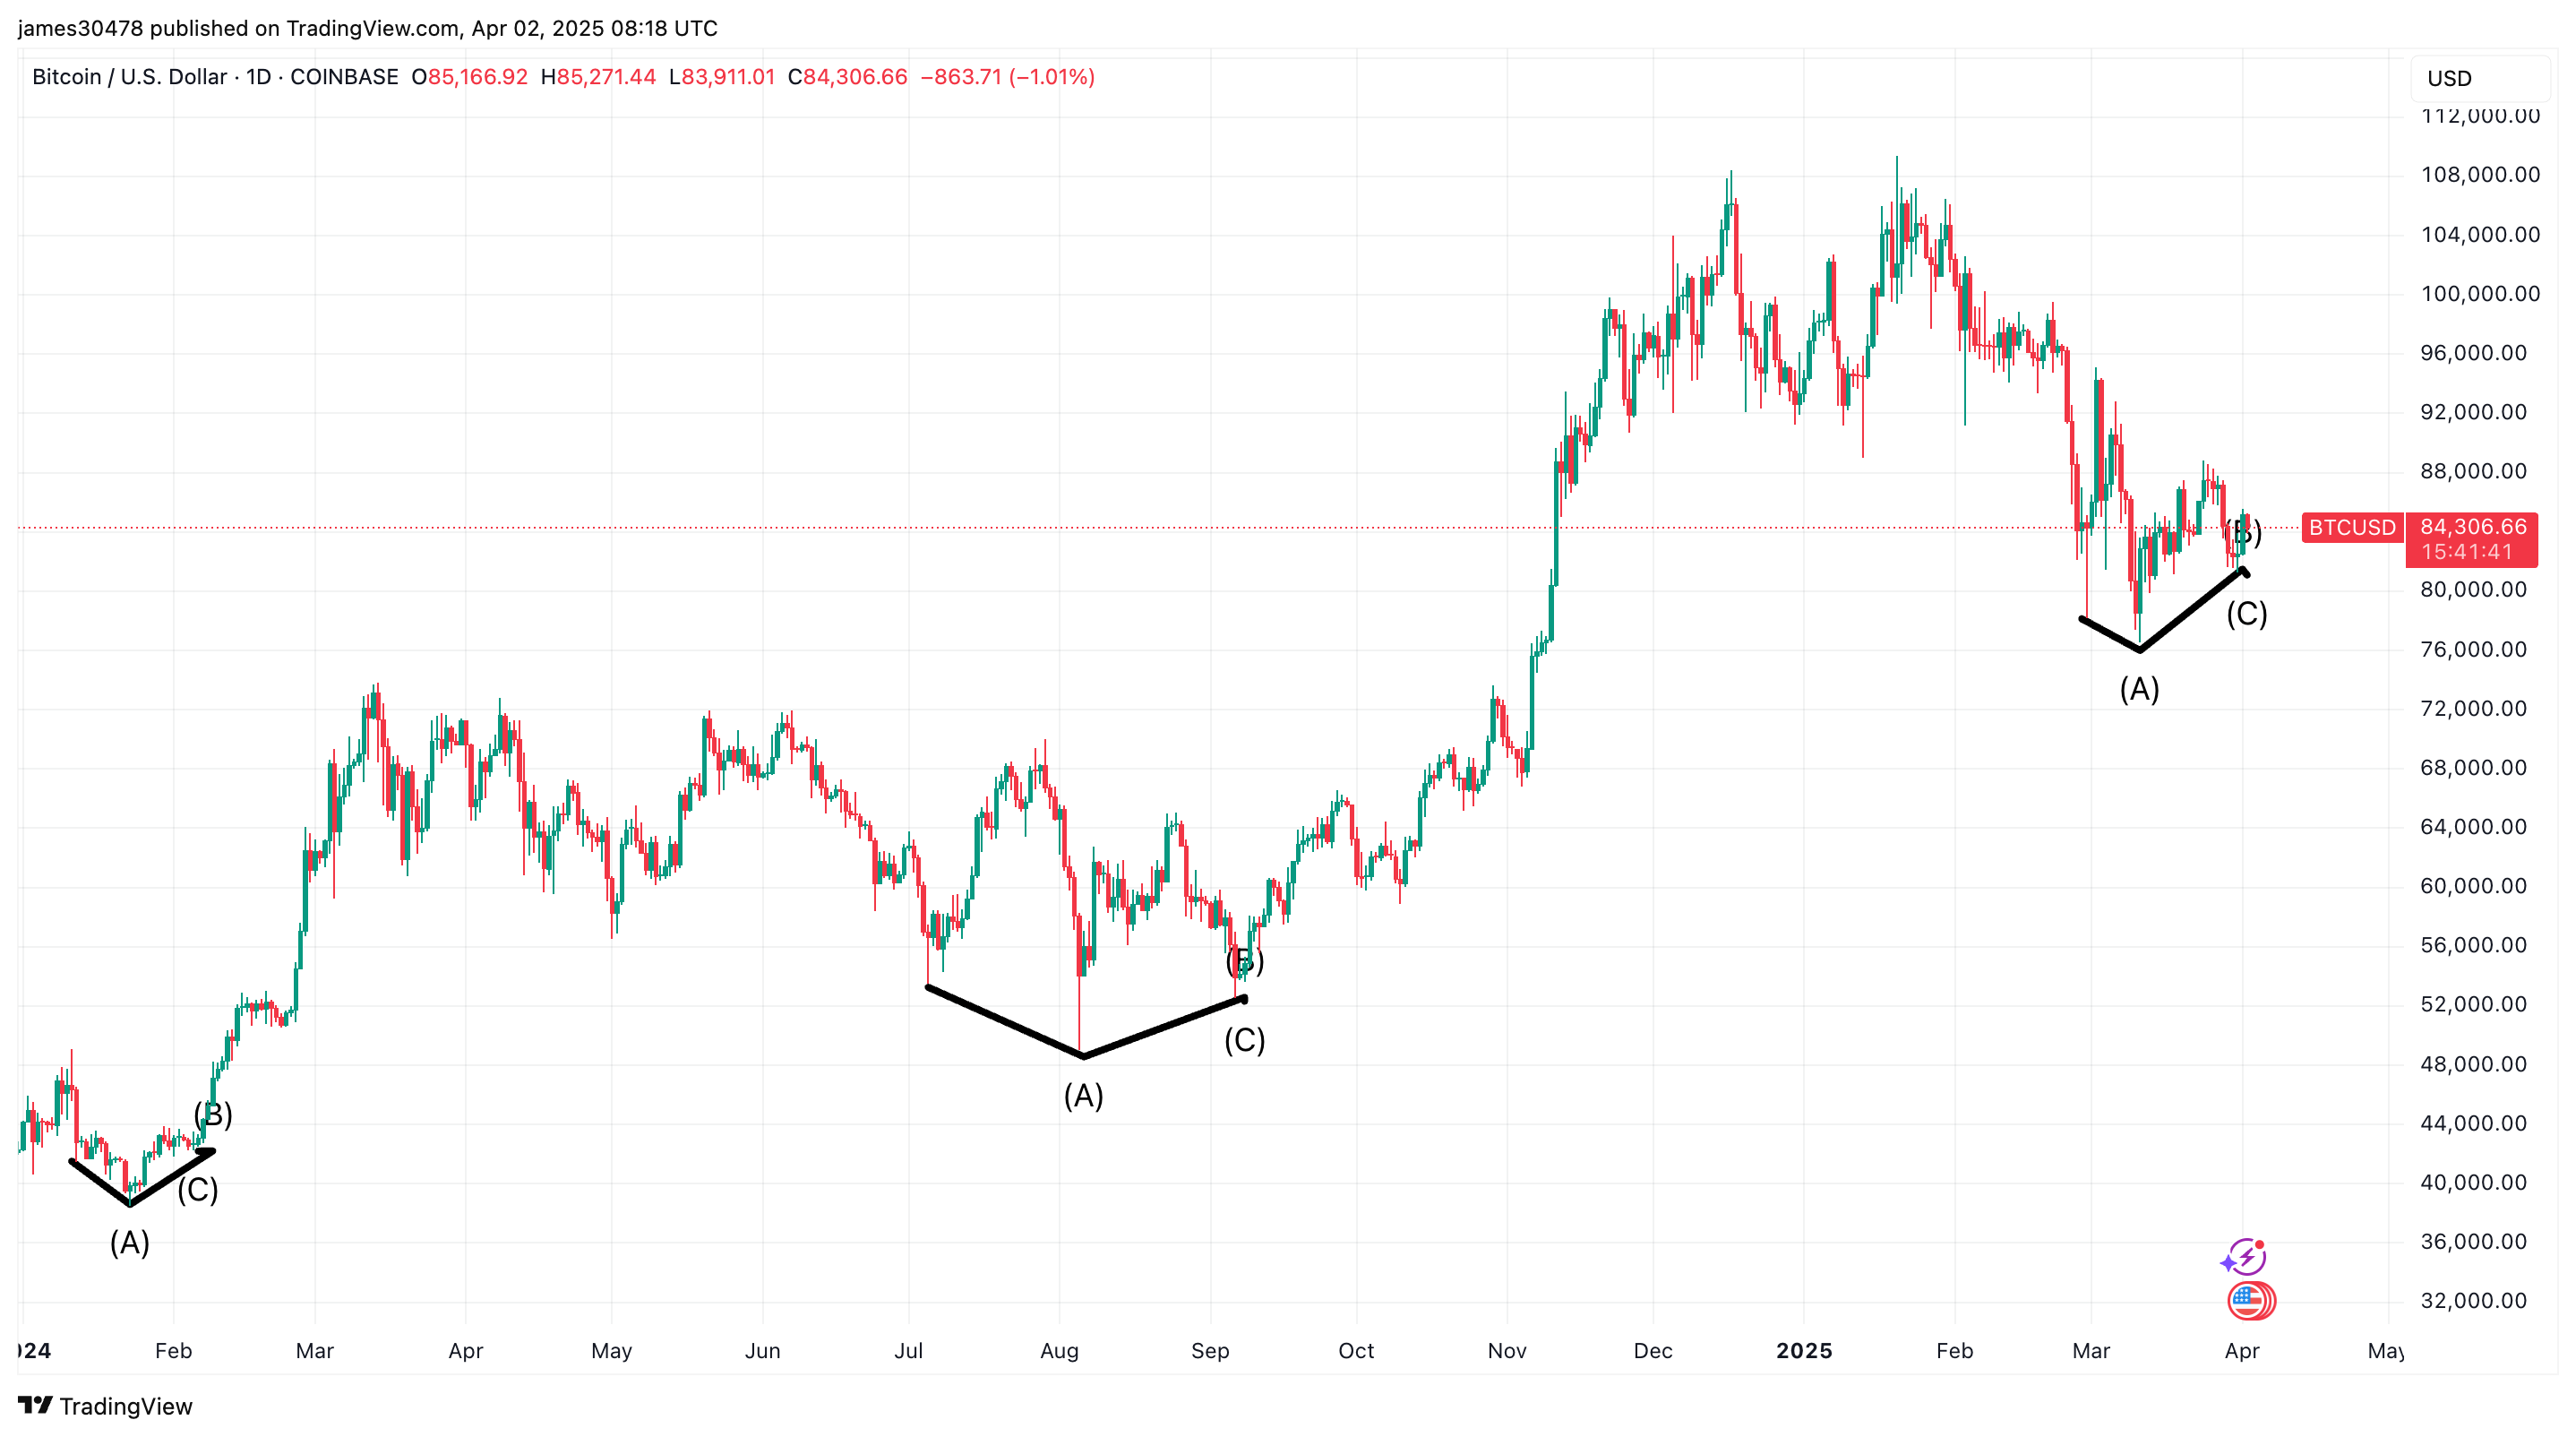
In this current correction, bitcoin fell 30% from it’s all-time high of $109,000 reached on Jan. 20. After hitting a low on March 10, it recorded higher lows on both sides of that date—around $78,000 on Feb. 28 and just above $81,000 on March 31—forming a triangular bottom.
A similar pattern played out during the yen carry trade unwind in August 2024, when bitcoin bottomed near $49,000 on Aug. 5. Again, higher lows were seen on either side: on July 7 and September 7.
Another instance occurred during the launch of the U.S. spot bitcoin ETFs in January 2024. Bitcoin experienced a 20% correction, hitting a low just below $40,000 on Jan. 23, with higher lows on both sides of that date as well.
Omkar Godbole, managing editor of CoinDesk Markets, also points to signs that bitcoin could be bottoming out, noting the emergence of a bullish structure. “The latest pattern, indicating a shift from lower lows to higher lows and signifying seller exhaustion, resembles bottoming patterns seen in August and early 2024,”.
“There’s reason to consider the possibility of renewed bullish momentum—though, as always, external risks like Trump’s tariffs could disrupt the trend”, Godbole says.